Demographic Analysis (DEMOG) Remaining life expectancy by level of education
Increased life expectancy among foreign-born men with low education
Statistical news from Statistics Sweden 2023-05-24 8.00
Life expectancy increased between 2012 and 2019 in all educational groups, while in 2020 life expectancy fell in all groups, especially among the foreign born. But in 2021 it increased again. For the Swedish born with post-secondary education, life expectancy was slightly higher in 2022 than 2019.
Average life expectancy has increased steadily for both women and men, and for both those born in Sweden and those born abroad. However, life expectancy decreased in 2020 due to the high mortality rate from COVID-19. In 2021, life expectancy increased again and returned almost to the same level as in 2019. Nonetheless, a continued increase was only seen among those with post-secondary education in 2022.
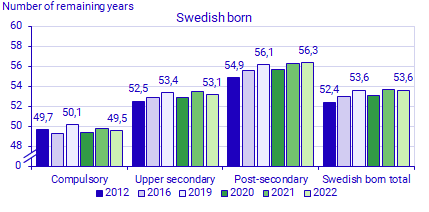
In 2022, remaining life expectancy at age 30 was 55 years for women and 52 years for men. This applied to both Swedish and foreign-born women and men. Compared with 2012, life expectancy at age 30 has increased by one year, despite the noticeable decrease in 2020 due to the high mortality rate from COVID-19. The decrease in 2020 was visible in all educational groups, especially among the foreign born. The largest decrease was seen among the foreign born with compulsory education and post-secondary education, 1.2 years.
There are clear differences in life expectancy between groups with different levels of education. Life expectancy is a few years higher for people with upper secondary education than for those with compulsory education, and in turn life expectancy is a few years higher for those with post-secondary education than for those with upper secondary education.
In the period from 2012 to 2022, the differences between educational groups somewhat increased, and more so among the Swedish born. This is because average life expectancy has increased clearly for those with post-secondary education since 2012, but not for those with compulsory education. In 2022, the difference between the group with post-secondary education and the group with compulsory education was nearly 7 years for the Swedish born while the gap was around 5 years in 2012. The difference between the groups with post-secondary education and upper secondary education have also increased, from 2 to 3 years.
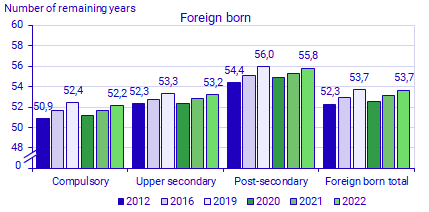
Life expectancy differences between the educational groups are smaller among the foreign born than among the Swedish born. Among the foreign born, the differences between those with post-secondary education on one hand and compulsory education and upper secondary education on the other was 3.5 and 2.5 years respectively. Overall, life expectancy for the Swedish born and the foreign born is roughly at the same level. However, among those with compulsory education, life expectancy has been a couple of years higher for the foreign born than for the Swedish born; among those with post-secondary education, life expectancy was slightly higher for the Swedish born than for the foreign born. This contributes to a larger difference in life expectancy between educational groups among the Swedish born than among the foreign born. Similar group differences can be seen when the statistics are displayed by sex. The results are not shown here but is available in the statistical database.
There is only one group that has a higher life expectancy in 2022 than in 2019, that is, the Swedish born with post-secondary education. It is this group that has had the highest life expectancy over time. It is also this group that had the smallest decrease in life expectancy between 2019 and 2020. Regarding the most recent development of life expectancy between 2021 and 2022, a clear increase in average life expectancy can be seen in all educational groups for the foreign born. For the Swedish born, however, an increase was seen only in the group with post-secondary education.
Largest increase in life expectancy among foreign-born men with low education
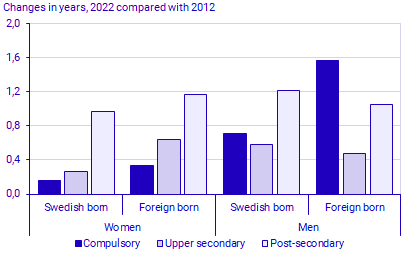
In Sweden more than 90 percent of deaths occur among people aged over 64 years old. This applies to both women and men. It is changes of death rates at older ages that affect most how life expectancy increases or decreases, as shown in recent years during the COVID-19 pandemic. Between 2012 and 2022, remaining life expectancy at age 65 has increased by approximately one year, from 21 to nearly 22 years for women and from around 18.5 to 19.5 years for men.
In these years, the increase in average life expectancy at age 65 is almost the same for women and men, but the increase differs by educational groups. For women and men born in Sweden and for women born abroad, the increase is the largest for those with post-secondary education and the smallest for those with compulsory education. But for the foreign-born men, the average life expectancy has increased the most for the group with compulsory education. It is also this group that had the largest increase between 2012 and 2022, 1.6 years. The increase in differences in life expectancy at age 65 between educational groups is the clearest among women. The Swedish born women with compulsory education and upper secondary education has had the smallest increase in remaining life expectancy at age 65. From this age, no group has a lower life expectancy in 2022 compared to 2012.
Clear differences in all counties
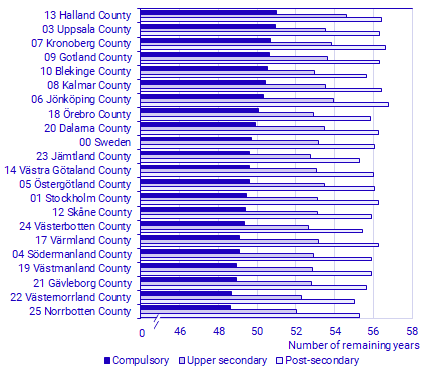
Differences in the number of remaining years at age 30 between groups with different educational levels exist in all Swedish counties. This applies to both women and men. Here, it is shown only for both sexes combined.
Statistics sorted by the number of remaining years for the group with compulsory education
There exists some variation between the counties in the number of remaining years at age 30. In the group with compulsory education, those who live in Halland County have the highest number of remaining years, 51 years, whereas those who live in Norrbotten County have the lowest number of remaining years, 48.6 years. In the group with upper secondary education, those who live in Halland County have the highest number of remaining years, 54.6 years wheras those who live in Norrbotten County have the lowest, 52 years. In the group with post-secondary education, those who live in Jönköping County have the higher number of remaining years, 56.8 years whereas those who live in Västernorrland County have the lowest, 55 years. The differences between the group with post-secondary education and the group with compulsory education have become more similar over time in different counties. In the period 2018—2022, the difference between these educational groups was smallest in Blekinge County, 5.1 years, and largest in Värmland County, 7.1 years.
Definitions and explanations
Average remaining life expectancy is normally referred to as “life expectancy”. This is an index that describes mortality in all ages for a year or a specific period. Mortality is shown in a life table and the average number of years remaining is calculated for all ages. Here, the number of remaining years is reported from the age of 30 and 65 years.
The statistics refer to persons aged 30 years and older who were registered in the population various years between 2011 and 2022. In the statistical database there is more information and complete life tables.
These statistics have been produced based on data in Statistics Sweden’s Population Register, Household Register, and Education Register.
Publication
These statistics are published as complete life tables from 30 years in the Statistical Database on Statistics Sweden in the following tables 2012–2022:
• Life tables by level of education, region of birth (Swedish born and foreign born), sex and age. Year 2012–2022
• Life tables by level of education, type of household, sex and age. Year 2012–2022 (limited to the population born in Sweden)
• Life tables by level of education, county, sex and age. Five-year period 2012–2016 to 2018–2022 (limited to the population born in Sweden)
These statistics are also published in tables and figures with comments on remaining life expectancy at 30 years and at 65 years.
Feel free to use the facts from this statistical news but remember to state Source: Statistics Sweden.