Exports and imports of goods, quarter 4 2023/January-December 2023, in current prices and in constant prices
Continued stronger exports of goods compared to imports of goods in the fourth quarter
Statistical news from Statistics Sweden 2024-02-28 8.00
In the fourth quarter 2023, exports of goods increased by 3 percent in value and by 1 percent in volume compared with the same period a year ago. At the same time, imports of goods fell by 4 percent in value and by 5 percent in volume.
- In 2023, imports from Norway decreased by 13 percent which amounted to about SEK 32 billion. Mineral fuels and electric current accounted for the largest decrease, says Ari Mansikkaviita, statistician at Statistics Sweden.
Summary
- In the fourth quarter of 2023, Swedish exports of goods increased by 3 percent in value (in current prices), and in terms of volume (in constant prices) they rose by 1 percent, compared with the same period a year ago. Imports of goods decreased by 4 percent in value, and in terms of volume they fell by 5 percent.
- Compared with the previous quarter, Swedish exports of goods increased by 11 percent in value and by 12 percent in volume. Imports of goods rose by 7 percent in value and by 8 percent in volume.
- In the period January–December 2023, the value of Swedish exports of goods amounted to SEK 2 103 billion, an increase of 5 percent compared with the same period a year ago. At the same time, the value of imports of goods remained the same and amounted to SEK 2 048 billion.
- In the period January–December 2023, exports of goods increased by 1 percent in volume, while they fell by 4 percent in volume.
- Net trade shows a surplus of SEK 55 billion in the period January–December 2023. In the same period in 2022, there was a net trade deficit of SEK 55 billion.
Detailed information about the fourth quarter 2023 (in current prices and in constant prices)
Exports of mineral fuels and electric current decreased by 23 percent in value while they remained the same in volume
In the fourth quarter of 2023, Sweden’s exports of goods increased by 3 percent in value and by 1 percent in volume, compared with the corresponding period a year ago.
Exports of machinery and transport equipment increased by 14 percent in value and by 5 percent in volume. Within the product area, exports of passenger cars increased by 30 percent in value and by 23 percent in volume. Exports of mineral fuels and electric current fell by 23 percent in value while they remained the same in volume. Within the other products area, exports of food/beverages/tobacco increased by 8 percent in value and by 7 percent in volume.
| Exports | ||||||||
|---|---|---|---|---|---|---|---|---|
| Value (current prices) | Value (current prices) | Volume (value in constant prices) | Value (current prices) | Volume (value in constant prices) | ||||
| Share in % | Change in % | Change in % | Change in % | Change in % | ||||
| Commodity group according to SITC | January-December 2023 | January-December 2022 | January-December 2023 | Q1-4 2023/Q1-4 2022 | Q1-4 2023/Q1-4 2022 | Q4 2023/Q4 2022 | Q4 2023/Q4 2022 | |
| Total | 2 103 026 | 1 997 852 | 100.0 | 5 | 1 | 3 | 1 | |
| Wood and paper products | 184 374 | 198 539 | 8.8 | ‑7 | ‑3 | ‑10 | ‑3 | |
| Wood | 42 467 | 53 713 | 2.0 | ‑21 | 9 | ‑14 | ‑5 | |
| Pulp and waste paper | 33 291 | 32 324 | 1.6 | 3 | 5 | 5 | 30 | |
| Paper, paper products | 100 575 | 103 614 | 4.8 | ‑3 | ‑10 | ‑13 | ‑6 | |
| Minerals | 225 936 | 222 838 | 10.7 | 1 | 1 | 10 | 11 | |
| Iron ore and concentrates | 42 927 | 37 538 | 2.0 | 14 | 15 | 31 | 28 | |
| Iron and steel | 88 072 | 92 978 | 4.2 | ‑5 | ‑5 | ‑12 | ‑7 | |
| Non-ferrous metals | 51 773 | 48 322 | 2.5 | 7 | 7 | 56 | 52 | |
| Chemicals, rubber products | 310 208 | 297 450 | 14.8 | 4 | 0 | ‑5 | ‑7 | |
| Organic/inorganic chemicals | 31 165 | 29 943 | 1.5 | 4 | 5 | 5 | 21 | |
| Pharmaceutical products | 152 521 | 139 269 | 7.3 | 10 | 3 | ‑6 | ‑11 | |
| Plastics | 46 502 | 51 586 | 2.2 | ‑10 | ‑5 | ‑14 | ‑8 | |
| Mineral fuels, electric current | 169 788 | 217 008 | 8.1 | ‑22 | ‑4 | ‑23 | 0 | |
| Petroleum products | 139 887 | 160 148 | 6.7 | ‑13 | ‑3 | ‑13 | 0 | |
| Machinery, transport equipment | 927 177 | 795 472 | 44.1 | 17 | 4 | 14 | 5 | |
| Manufactures of metals | 50 536 | 48 812 | 2.4 | 4 | ‑4 | 5 | ‑2 | |
| Industrial machinery | 301 038 | 255 819 | 14.3 | 18 | 5 | 10 | 1 | |
| Electronics, telecommunication | 207 998 | 193 925 | 9.9 | 7 | ‑7 | 8 | ‑1 | |
| Road vehicles | 309 483 | 243 415 | 14.7 | 27 | 14 | 23 | 14 | |
| Passenger cars | 164 253 | 123 799 | 7.8 | 33 | 23 | 30 | 23 | |
| Lorries, trucks[1] | 50 243 | 40 526 | 2.4 | 24 | 1 | 10 | ‑7 | |
| Parts, accessories | 73 361 | 60 553 | 3.5 | 21 | 10 | 22 | 14 | |
| Other transport equipment | 11 617 | 10 916 | 0.6 | 6 | 1 | 90 | 99 | |
| Instruments, photo/optical products | 46 504 | 42 585 | 2.2 | 9 | 0 | 4 | ‑3 | |
| Other products | 285 542 | 266 544 | 13.6 | 7 | ‑1 | 3 | ‑1 | |
| Food, beverages, tobacco | 143 417 | 129 442 | 6.8 | 11 | 3 | 8 | 7 | |
| Textiles, clothing, footwear | 54 858 | 53 944 | 2.6 | 2 | ‑6 | ‑5 | ‑14 | |
| Furniture | 23 675 | 23 558 | 1.1 | 0 | ‑13 | ‑1 | ‑11 | |
Imports of wood and paper products fell by 18 percent in value and by 13 percent in volume
In the fourth quarter of 2023, Sweden’s imports of goods decreased by 4 percent in value and by 5 in volume compared with the corresponding period a year ago.
Imports of machinery and transport equipment increased by 4 percent in value, while they decreased by 1 percent in volume. Imports of wood and paper products decreased by 18 percent in value and by 13 percent in volume. Imports of mineral fuels and electric current fell by 25 percent in value and by 12 percent in volume. Within the other products area, imports of food/beverages/tobacco increased by 4 percent in value and by 1 percent in volume.
| Imports | ||||||||
|---|---|---|---|---|---|---|---|---|
| Value (current prices) | Value (current prices) | Volume (value in constant prices) | Value (current prices) | Volume (value in constant prices) | ||||
| Share in % | Change in % | Change in % | Change in % | Change in % | ||||
| Commodity group according to SITC | January-December 2023 | January-December 2022 | January-December 2023 | Q1-4 2023/Q1-4 2022 | Q1-4 2023/Q1-4 2022 | Q4 2023/Q4 2022 | Q4 2023/Q4 2022 | |
| Total | 2 047 681 | 2 053 223 | 100.0 | 0 | ‑4 | ‑4 | ‑5 | |
| Wood and paper products | 52 213 | 56 593 | 2.5 | ‑8 | ‑14 | ‑18 | ‑13 | |
| Minerals | 157 962 | 172 496 | 7.7 | ‑8 | ‑6 | ‑5 | 0 | |
| Iron and steel | 64 722 | 75 944 | 3.2 | ‑15 | ‑6 | ‑11 | ‑1 | |
| Non-ferrous metals | 36 016 | 38 724 | 1.8 | ‑7 | ‑1 | 12 | 21 | |
| Metalliferrous ores, metal scrap | 26 371 | 25 682 | 1.3 | 3 | 4 | ‑16 | ‑14 | |
| Chemicals, rubber products | 261 925 | 266 158 | 12.8 | ‑2 | ‑5 | ‑4 | ‑5 | |
| Organic/inorganic chemicals | 61 385 | 61 110 | 3.0 | 0 | ‑4 | 0 | ‑1 | |
| Pharmaceutical products | 70 531 | 66 437 | 3.4 | 6 | ‑2 | 1 | ‑4 | |
| Plastics | 43 091 | 49 655 | 2.1 | ‑13 | ‑7 | ‑11 | ‑4 | |
| Crude rubber, rubber products | 21 746 | 21 587 | 1.1 | 1 | ‑10 | ‑6 | ‑9 | |
| Mineral fuels, electric current | 228 961 | 288 680 | 11.2 | ‑21 | ‑5 | ‑25 | ‑12 | |
| Crude petroleum oils | 119 271 | 151 581 | 5.8 | ‑21 | ‑9 | ‑18 | ‑13 | |
| Petroleum products | 84 382 | 97 444 | 4.1 | ‑13 | ‑5 | ‑24 | ‑16 | |
| Machinery, transport equipment | 914 575 | 829 874 | 44.7 | 10 | 1 | 4 | ‑1 | |
| Manufactures of metals | 63 506 | 68 565 | 3.1 | ‑7 | ‑13 | ‑7 | ‑7 | |
| Industrial machinery | 213 209 | 196 638 | 10.4 | 8 | ‑3 | 0 | ‑8 | |
| Electronics, telecommunication | 329 366 | 305 084 | 16.1 | 8 | 0 | 0 | 0 | |
| Road vehicles | 237 599 | 199 130 | 11.6 | 19 | 8 | 6 | ‑2 | |
| Passenger cars | 121 091 | 98 927 | 5.9 | 22 | 14 | 0 | ‑6 | |
| Parts and accessories | 71 737 | 61 257 | 3.5 | 17 | 0 | 15 | 6 | |
| Other transport equipment | 20 425 | 12 903 | 1.0 | 58 | 51 | 161 | 163 | |
| Instruments, photo/optical equip | 50 470 | 47 553 | 2.5 | 6 | ‑4 | 3 | ‑6 | |
| Other products | 432 044 | 439 422 | 21.1 | ‑2 | ‑11 | ‑5 | ‑8 | |
| Food, beverages, tobacco | 228 304 | 209 293 | 11.1 | 9 | ‑1 | 4 | 1 | |
| Textiles, clothing, footwear | 91 935 | 105 068 | 4.5 | ‑12 | ‑20 | ‑19 | ‑22 | |
| Furniture | 26 866 | 31 501 | 1.3 | ‑15 | ‑24 | ‑9 | ‑13 | |
Value and volume trends
The value index and the volume index describe nominal and real value trends over time. The real value trends describe trends in which price changes have been removed. The indices are chain indices with base year 2015=100.
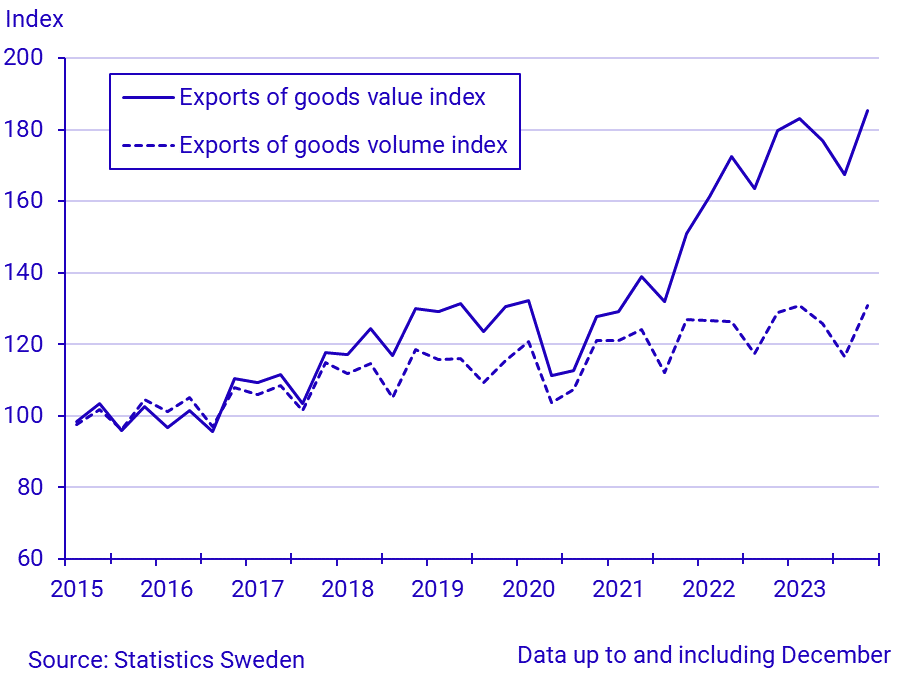
The value index and the volume index for exports increased in the fourth quarter compared to the third quarter. The positive value trend which was broken in the second quarter is now on its way up again. The value index reached a peak of 185. The volume index was higher the fourth quarter compared to the same period last year.
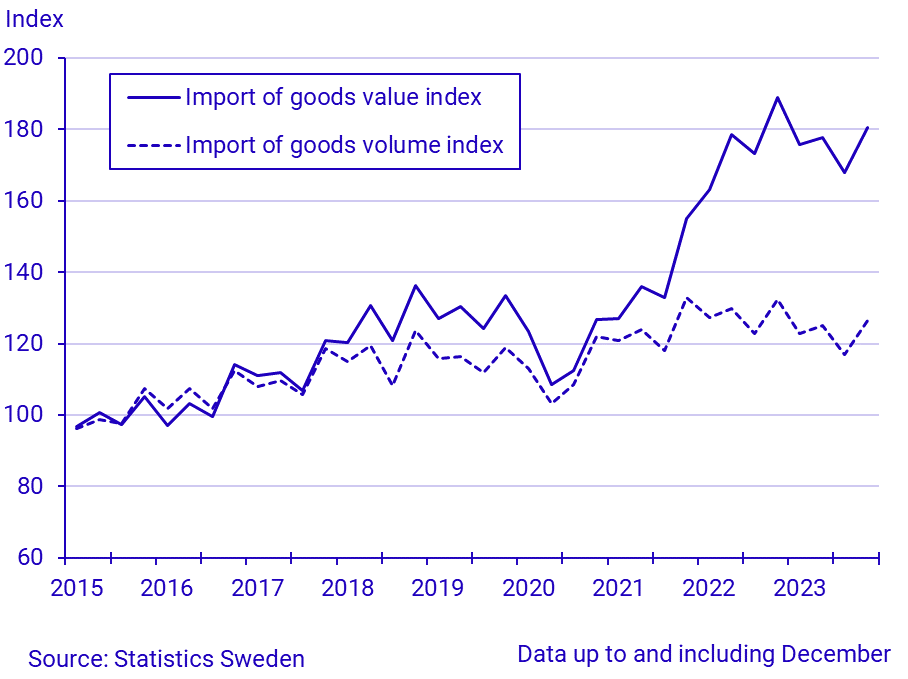
The value index and the volume index for imports of goods increased in the fourth quarter compared to the third quarter but are lower compared to the same period the year before.
Detailed information about January–December 2023 (current prices)
Imports of goods from Norway fell by 13 percent
Sweden’s exports of goods to EU27 increased by 7 percent, and imports from there increased by 6 percent compared with the same period a year ago. Exports to the euro countries rose by 9 percent, and imports from there increased by 6 percent. Among the EU countries, exports to Germany increased by 9 percent, while the exports to both Denmark and Finland fell by 1 percent. Imports from Germany increased by 8 percent, from Finland by 4 percent while they remained the same from Denmark.
Exports to other European countries remained the same, while imports from there decreased by 10 percent. Exports to the United Kingdom rose by 3 percent, while imports from there fell by 11 percent. Exports to Norway decreased by 6 percent, and imports from there fell by 13 percent. Exports to Russia fell by 8 percent and imports from there by 95 percent.
Exports to Asia rose by 6 percent, while imports from there fell by 16 percent. Exports to China increased by 8 percent, while imports from there decreased by 24 percent.
Exports to the United States increased by 2 percent, while imports from there decreased by 8 percent.
| Exports | Imports | ||||||||
|---|---|---|---|---|---|---|---|---|---|
| Value (current prices) | Value (current prices) | ||||||||
| Region | January-December | Share in % | Change in % | January-December | Share in % | Change in % | |||
| 2023 | 2022 | 2023 | 2023/2022 | 2023 | 2022 | 2023 | 2023/2022 | ||
| Total | 2 103 026 | 1 997 852 | 100.0 | 5 | 2 047 681 | 2 053 223 | 100.0 | 0 | |
| Europe | 1 540 322 | 1 468 571 | 73.2 | 5 | 1 723 808 | 1 684 067 | 84.2 | 2 | |
| EU27_2020 | 1 151 524 | 1 078 217 | 54.8 | 7 | 1 380 552 | 1 301 458 | 67.4 | 6 | |
| EMU-20 | 876 605 | 804 339 | 41.7 | 9 | 1 089 138 | 1 024 507 | 53.2 | 6 | |
| Other European countries | 388 799 | 390 353 | 18.5 | 0 | 343 257 | 382 609 | 16.8 | ‑10 | |
| Africa | 37 296 | 35 749 | 1.8 | 4 | 21 303 | 23 265 | 1.0 | ‑8 | |
| North Africa | 17 849 | 16 979 | 0.8 | 5 | 8 069 | 5 269 | 0.4 | 53 | |
| West Africa | 4 290 | 4 525 | 0.2 | ‑5 | 9 014 | 14 273 | 0.4 | ‑37 | |
| Central, East and Southern Africa | 15 157 | 14 245 | 0.7 | 6 | 4 221 | 3 724 | 0.2 | 13 | |
| America | 260 837 | 244 275 | 12.4 | 7 | 92 495 | 98 964 | 4.5 | ‑7 | |
| North America | 216 886 | 201 839 | 10.3 | 7 | 74 930 | 80 921 | 3.7 | ‑7 | |
| Central and South America | 43 951 | 42 436 | 2.1 | 4 | 17 565 | 18 043 | 0.9 | ‑3 | |
| Asia | 232 710 | 220 291 | 11.1 | 6 | 201 267 | 239 179 | 9.8 | ‑16 | |
| Middle- and Near East | 39 106 | 35 240 | 1.9 | 11 | 10 595 | 7 627 | 0.5 | 39 | |
| Other countries in Asia | 193 605 | 185 052 | 9.2 | 5 | 190 673 | 231 553 | 9.3 | ‑18 | |
| Oceania and Antarctica | 22 542 | 20 554 | 1.1 | 10 | 8 755 | 7 706 | 0.4 | 14 | |
Exports of passenger cars increased by 33 percent
Exports of machinery and transport equipment increased by 17 percent. Within this product area, exports of passenger cars rose by 33 percent. Exports of wood and paper products fell by 7 percent, and mineral fuels and electric current decreased by 22 percent. Within the other products area, food/beverages/tobacco increased by 11 percent.
Imports of mineral fuels and electric current fell by 21 percent
Imports of machinery and transport equipment increased by 10 percent. Within this product area, imports of passenger cars rose by 22 percent. Imports of both minerals and wood and paper products decreased by 8 percent. Imports of mineral fuels and electric current fell by 21 percent. Within the other products area, imports of food/beverages/tobacco increased by 9 percent.
Definitions and explanations
The United Kingdom’s withdrawal from the European Union has led to the replacement of the former EU28 group in the country tables for foreign trade in goods with the EU27_2020 group. This change applies to country tables with data reported as from January 2020.
Next publishing will be
2024-05-28 at 08:00.
Statistical Database
More information is available in the Statistical Database
Feel free to use the facts from this statistical news but remember to state Source: Statistics Sweden.