New registrations, October 2019
Registration of new cars increased by 26 percent in October
Statistical news from Statistics Sweden 2019-11-04 9.30
In October 2019, 30 493 passenger cars were newly registered, up 26 percent from October last year. This, according to Transport Analysis’ monthly official statistics on newly registered vehicles.
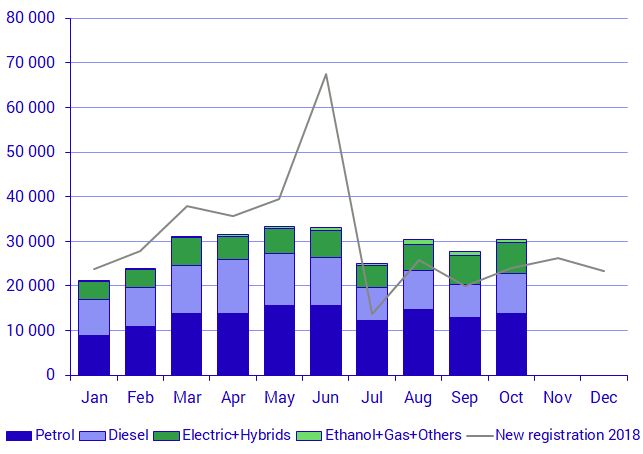
Passenger cars defined as a “klimatbonusbil”, that is, electric, plug-in hybrids and gas cars (natural, bio- and methane gas), accounted for 12.8 percent of newly registered passenger cars in October. Diesel cars accounted for 29.6 percent of all new passenger car registrations, which is a decrease of 2.5 percent compared with the same month last year. The bonus malus system, introduced on 1 July 2018, affects comparisions with the previous year throughout 2019.
Among newly registered cars, 29 804 were of model year 2017 or later, and 689 were older models. In October, 30 892 passenger cars were deregistered, which means that the total passenger car fleet decreased by 399 passenger cars.
Among new car registrations, 64 percent were registered by businesses and organisations. Businesses in the car retail trade accounted for 23 percent of total new registrations. Among cars registered by private persons, men accounted for 66 percent and women accounted for 34 percent of registrations.
In October, 4 669 lorries were newly registered, up 10 percent compared with the same month last year. Among newly registered lorries, there were 3 985 light lorries with a weight up to 3.5 tonnes, which is an increase of 18 percent, and 684 heavy lorries with a weight over 3.5 tonnes, which is a decrease of 21 percent compared with October 2018.
New registrations January – October 2019
New registrations of passenger cars between January and October 2019 decreased by 9 percent compared with last year. There were 94 540 diesel cars in total registered thus far in 2019, a decrease of 21.4 percent compared with the corresponding period in 2018.
Passenger cars that can be powered by electricity (including hybrid electric and plug-in hybrids), ethanol, or gas accounted for 21.1 percent of new registrations between January and October 2019, compared with 14.3 percent in the corresponding period in 2018.
| Passenger cars, by fuel type | January–October 2019 | January–October 2018 | Changes in percent |
|---|---|---|---|
| Passenger cars | 287 470 | 315 764 | ‑9 |
| of which petrol | 132 396 | 150 396 | ‑12 |
| of which diesel | 94 540 | 120 287 | ‑21 |
| of which electric | 13 102 | 4 842 | 171 |
| of which hybrid electric | 24 175 | 17 805 | 36 |
| of which plug-in hybrid | 18 428 | 18 422 | 0 |
| of which ethanol | 583 | 947 | ‑38 |
| of which gas | 4 225 | 3 043 | 39 |
| Type of vehicle | January–October 2019 | January–October 2018 | Changes in percent |
|---|---|---|---|
| Passenger cars | 287 470 | 315 764 | ‑9.0 |
| of which Motorhomes (subset of passenger cars) | 4 339 | 7 646 | ‑43.3 |
| Lorries | 47 321 | 57 422 | ‑17.6 |
| Busses | 1 236 | 755 | 63.7 |
| Trailers | 45 749 | 48 793 | ‑6.2 |
| of which Caravans | 3 529 | 3 698 | ‑4.6 |
| Tractors | 8 594 | 7 112 | 20.8 |
| Motorcycles | 12 086 | 11 923 | 1.4 |
| Class 1 mopeds | 14 945 | 10 538 | 41.8 |
| Snowmobiles | 6 023 | 5 389 | 11.8 |
| Terrain vehicles | 3 764 | 3 514 | 7.1 |
Databases containing information for passenger cars on the county/municipality level and fuel for the years 2006–2019 are available in the Statistical database.
Transport Analysis is the government agency responsible for these statistics, and Statistics Sweden produces the statistics on its behalf. For detailed information on new registrations, please see ‘Monthly vehicle statistics’, which is available on the Transport Analysis website:
or on Statistics Sweden’s website:
Statistics Sweden-Registered vehicles
New registrations comprise all vehicles that were entered into the register during the month. These registrations differ from new registrations in BIL Sweden’s reports. BIL Sweden's data only contains data on cars of the latest three model years and cars that are not directly imported.
Key Facts about Transport Analysis
Transport Analysis is the government agency that analyses and evaluates Swedish transport policy and is responsible for official statistics in the field of transport. Transport Analysis also produces background data for transport policy decision-makers and promotes socioeconomically efficient and long-term sustainable transport services provision throughout Sweden.
Next publishing will be
Statistical news on new registrations in November will be published on 3 December 2019 at 09:30.
Statistical Database
More information is available in the Statistical Database
Feel free to use the facts from this statistical news but remember to state Source: Statistics Sweden.