Women and men in Sweden - Facts and figures 2024
- Published:
- 2024-11-05
Gender equality

Women and men must have the same power
to shape society and their own lives.
Gender equality – equality
The term gender equality is used to define the relationship between women and men. However, equality is a broader concept. It refers to parity in relations among all individuals and groups in society. Underlying this notion is the belief that all people are of equal value, regardless of sex, ethnic origin, religion or social class.
Swedish gender equality policy
The overall objective of gender equality policy is to ensure that women and men have equal power to shape society and their own lives. On this basis, the Government is working towards six sub-goals.
Equal distribution of power and influence
Women and men must have the same rights and opportunities to be active citizens and toshape the conditions for decision-making in all sectors of society.
Economic gender equality
Women and men must have the same opportunities and conditions for paid work that provide economic independence throughout life.
Gender equality in education
Women and men, girls and boys must have the same opportunities and conditions regarding education, study options and personal development.
An equal distribution of unpaid housework and provision of care work
Women and men must have the same responsibility for unpaid housework and the opportunity to give and receive care on equal terms.
Gender equality in health, care and social services
Women and men, girls and boys must have the same conditions for a good health and be offered care and social services on equal terms.
Men’s violence against women must stop
Women and men, girls and boys must have the same rights and opportunities to physical integrity.
National coordination of gender equality work
The Minister for Gender Equality coordinates the Government’s gender equality policies. All cabinet ministers are responsible for gender equality in their policy fields. The Division for Gender Equality is responsible, under the Minister for Gender Equality, for coordinating the Government’s gender equality efforts and specific gender equality initiatives. The Swedish Gender Equality Agency is an administrative authority responsible for contributing to efficient implementation of gender equality policy. The agency is tasked with follow-up, analysis, coordination, expertise and support with the aim of achieving the gender equality policy goals and they also are tasked with the distribution of government grants for gender equality projects, women's and girls' organization, and work with violence prevention.
The Equality Ombudsman supervises to ensure compliance with the Discrimination Act and the Parental Leave Act. There is a council against discrimination that can fine employers and educators if they do not honour their obligations to take preventive measures and to promote efforts to counteract discrimination on the basis of gender. The National Centre against Honour-based Violence and Oppression (NCH) at the County Administrative Board of Östergötland is tasked with contributing to strategic, preventive and knowledge-based work against honour-related violence and oppression at national, regional and local level. The National Centre for Knowledge on Men's Violence against Women (NCK) at Uppsala University and Uppsala University Hospital is tasked with raising awareness of men's violence against women, honour-related violence and oppression, and violence in same-sex relationships. Via national helplines, NCK also provides support to victims of violence who are women, men, non-binary people, and people with transgender experiences, as well as individuals exposed to honour-related violence and oppression.
Gender equality affects all areas of society
Gender mainstreaming is a political strategy to achieve gender equality in society. Gender mainstreaming is based on the understanding that gender equality is created where decisions are made, resources are allocated and norms are created. Therefore, a gender equality perspective must be incorporated into all decision-making processes by the parties that are normally involved in decision-making.
Gender equality and statistics
Women and men must be visible in the statistics
To enable this, statistics must be disaggregated by sex. Section 14 of The OffIcial Statistics Ordinance (2001:100) sets forth that offIcial statistics based on individuals should be broken down by sex unless there are specifc reasons for not doing so. Statistics Sweden has produced guidelines and support for the application of section 14, which can be downloaded from Statistics Sweden’s website. However, statistics broken down by sex alone are not sufficient for performing analyses on gender equality. For this purpose, statistics must also be used that illustrate gender equality issues in society. Statistics Sweden’s website has a thematic page (in Swedish only) with additional gender equality statistics, in addition to this publication: www.scb.se/jamstalldhet.
What does equal sex distribution mean?
There may be different definitions of what is meant by an equal sex distribution. In statistics, it is common for an equal sex distribution to mean that at least 40 percent are women and at least 40 percent are men. If a group consists of more than 60 percent women, it is female-dominated, and if it consists of more than 60 percent men it is male-dominated. This is the definition used in this publication. At the same time, one could reflect on whether the sex distribution is equal if it is always women who are close to 40 percent, and always men who are close to 60 percent, or vice versa.
Guide for readers
The information in this publication are mainly derived from productions of Statistics Sweden and other statistical agencies. The source is given next to each table/graph. In most places, the tables and graphs give absolute numbers and/or proportions (%) for various attributes among women and men.
Proportions (%) are used in two ways:
- Proportion (%) of all women and proportion (%) of all men with a certain characteristic, such as working part-time.
- Sex distribution (%) within a group, such as upper secondary school teachers.
Some area graphs reflect both the absolute numbers and sex distribution in various groups. Such graphs are shown in the section on Education. The area for each programme reflects the total number of graduates from this programme compared to other programmes.
The total figures in the tables are not always consistent with the partial figures because of rounding off. Some tables may contain rounding errors.
The Official Statistics symbol indicates statistics that are included in the official statistics.
![]()
The Labour Force Surveys (LFS) are included in the system for the official statistics. However, the tables and diagrams in this publication are specially processed data from the Labour Force Surveys and are not official statistics.
Please note that the content of the statistics may change and that they may not be comparable over time. For further information regarding comparability and other aspects of statistical quality, readers are referred to the sources indicated. See also Statistics Sweden’s website at www.scb.se.
Some of the statistics in this publication come from sample surveys. Values derived from sample surveys are estimates that are subject to some uncertainty. This uncertainty can be expressed using uncertainty figures. Uncertainty figures are not reported in this publication. Instead, they are available on Statistics Sweden’s website at www.scb.se/LE0201.
Legend:
– No observation (magnitude zero).
0 Magnitude less than half of unit.
.. Information is not available or is too uncertain to use.
. Category not applicable.
Population
The composition of the population can provide important information for interpreting statistics on the living conditions of women and men. For example, an ageing population brings about an increased need for care, which has implications in several areas for women and men.
Forty years ago, the population of Sweden was around 8.3 million, of which 4.2 million were women and 4.1 million men. Historically, population growth in Sweden has been the result of more people being born than dying, but since the middle of the 20th century, net immigration has played a greater role.
In this chapter, we describe Sweden’s current population and its composition as well as how it has changed over time

Demography - Population composition
Since 1900, Sweden's population has doubled. Throughout the 20th century, the population consisted of slightly more women than men, but in 2015, for the first time, men outnumbered women. Two years later, in 2017, we passed the 10-million mark, and by 2023 we were approximately 5.2 million women and 5.3 million men.
Population in Sweden 1900 - 2023
Annual population growth has varied over time and depends on the number of births and deaths, as well as immigration and emigration. From the beginning of the 20th century until the 1970s, population growth in Sweden was mainly due to the number of births exceeding the number of deaths. Every year, slightly fewer girls are born than boys. The number of women and men who die in a year depends largely on prior mortality and on the change in average life expectancy. Women live slightly longer on average than men.
In the mid-20th century, the number of people who immigrated increased. This was partly due to labour immigration in the 1950s and 1960s, and later to the receipt of refugees and family reunification. Today, population growth is mainly due to the number of immigrants exceeding the number of emigrants, i.e., positive net migration. Among both immigrants and emigrants, there are usually fewer women than men. As a result, net migration is usually roughly equal for women and men. However, during periods when net migration is highest, such as in the mid-2010s, the increase has tended to be greater for men than for women.
In 2023, Sweden had the lowest relative population growth since 2000, due to decreased net migration and decreased childbearing.
The 20th century has seen several major changes. Women are giving birth to fewer children on average, life expectancy has increased and Sweden has gone from being a country of emigrants to a country that receives large numbers of immigrants. It is mainly the first two factors that have changed the age structure of the population, as the proportion of children has decreased and the proportion of elderly has increased.
Population by age, 1900
Population by age, 2023
Population by Swedish/foreign background and age, 2023
| 0-19 years | 20-65 years | 66- years | ||||
| Women | Men | Women | Men | Women | Men | |
| Born abroad | 10 | 10 | 27 | 27 | 15 | 14 |
|---|---|---|---|---|---|---|
| Living in Sweden 0–4 years1 | 4 | 4 | 5 | 5 | 0 | 0 |
| Living in Sweden 5– years1 | 6 | 6 | 22 | 22 | 14 | 13 |
| Born in Sweden | 90 | 90 | 73 | 73 | 85 | 86 |
| with both parents born abroad |
17 | 17 | 5 | 5 | 1 | 1 |
| with one parent born abroad |
13 | 13 | 7 | 7 | 4 | 4 |
| with both parents born in Sweden |
61 | 61 | 61 | 61 | 81 | 81 |
| Total percent | 100 | 100 | 100 | 100 | 100 | 100 |
| Number | 1 173 | 1 243 | 2 966 | 3 105 | 1 100 | 964 |
Households
About one fifth of households in Sweden consist of cohabiting persons with children, and slightly less than a quarter consist of cohabiting persons without children. The proportion of households consisting of a single woman is the same as that of a single man, around 20 per cent. Women living alone with children make up four per cent of households, and men living alone with children make up two per cent.
Households by type of household, 2023
| Type of household | Number | % |
| Cohabiting without children | 1 176 | 24 |
| Cohabiting with children | 1 004 | 20 |
| Single woman with children | 211 | 4 |
| Single man with children | 79 | 2 |
| Single woman living alone | 1 039 | 21 |
| Single man living alone | 1 010 | 20 |
| Other family households | 414 | 8 |
| Total | 4 932 | 100 |
|---|
There are small differences in the housing situation of girls and boys whose parents do not live together. A slightly higher proportion of boys than girls live roughly equal amounts of time in the homes of both parents, while a slightly higher proportion of girls than boys live only or mostly with their mother. A small proportion of both girls and boys live only or mostly with their father.
Housing situation of girls and boys whose parents do not live together, 2023
Natality
Historically, wars and economic crises are examples of events that have impacted the number of children born. The number of children born is also impacted by the number of women of childbearing age.
The total fertility rate, which is the sum of the average number of births per woman, was 1.5 children per woman in 2023. This is the lowest level measured.
Total fertility rate, 1890–2023
First time parents
In 2023, the average age for becoming a mother was 30 and the average age for becoming a father was 32.
While the childbearing rate is at a historically low level, the average age of new parents has never been higher than 2023. The average age of 30 for mothers and 32 for fathers in 2023 compares with 2000, when the average age of new parents was 28 for mothers and 31 for fathers. Forty years ago, the average age for becoming a mother was 26. The average age for becoming a father was not recorded in 1984.
Source: Population Statistics, Statistics Sweden

That we are having children later in life can be observed in the fact that a greater proportion of both women and men are childless when they are older. This trend has been observed over the course of many years, seen here in comparison with 1970, 1985 and 2000. However, the difference between the proportion of childless women and men is relatively constant, with the proportion of childless men being greater than the proportion of childless women in all age groups.
Childless people born in Sweden by age, 1970, 1985, 2000 and 2023
| Age | 1970 | 1985 | 2000 | 2023 | ||||
| Women | Men | Women | Men | Wommen | Men | women | Men | |
| 25 | 42 | 63 | 62 | 81 | 78 | 89 | 88 | 94 |
| 30 | 20 | 33 | 29 | 48 | 41 | 60 | 57 | 72 |
| 35 | 14 | 23 | 15 | 27 | 20 | 34 | 27 | 42 |
| 40 | 14 | 22 | 13 | 20 | 15 | 26 | 17 | 28 |
| 45 | 16 | 23 | 12 | 18 | 14 | 22 | 13 | 22 |
| 50 | .. | .. | .. | .. | 12 | 19 | 13 | 20 |
Abortions performed
In 2023, around 35,550 abortions were reported. Both the total number of abortions and the number of abortions per 1,000 women of childbearing age have remained relatively constant since the mid-1980s. However, the trend has varied across age groups, shifting from women under the age of 25 to women around the age of 30.
Abortions performed, 1951–2023
The Abortion Act
The Abortion Act (Abortlagen) was introduced in 1975. Under the Abortion Act, a woman has the right to decide to have an abortion up to the 18th week of pregnancy. After that, special authorisation from the Judicial Council of the Swedish National Board of Health and Welfare is required.
Source: Swedish National Board of Health and Welfare
Health, care and social services
How do women and men in Sweden fare, and how equal are the interventions offered by society?
Women and men, girls and boys must have the same conditions for a good health and be offered care and social services on equal terms.
Gender equality in health, care and social services is the fifth gender equality policy sub-goal. It is an expansive area, dealing with physical, mental, sexual and reproductive health. The well-being of women and men in a society is an important gender equality issue that can be linked to gender equality in many other areas. Economic status, education, unpaid housework or care work, and exposure to violence are all factors that affect physical and mental health. Health can also affect opportunities for education, earning a living and the capacity to contribute to the unpaid housework and care work.
In this chapter on health, care and social care, we describe, among other things, the well-being of women and men in Sweden as well as some of the interventions offered by society.
Sickness rates and sickness benefits
The sickness rate is a measure of the number of days during a 12-month period that the Swedish Social Insurance Agency pays out compensation for reduced work capacity, in relation to the number of insured persons aged 16-64.
Women aged 60-64 have the highest sickness rate. Women and men aged 16-19 have the lowest sickness rate. In all age groups from 20 years up to 64, women have higher sickness rates than men of the same age.
Sickness rate, by age, 2023
The Sickness Benefit Rate 2.0 shows how many days of sickness benefit have been paid out in relation to the number of employed people and jobseekers aged 15-69. Previously, "Women and men in Sweden - Facts and figures" published the Sickness Benefit Rate 1.0. Read more about the differences at the Social Insurance Agency.
The average number of sickness benefit days in 2023 was lowest in the younger age groups and highest in the 60-64 age group for both women and men. In all age groups over 20, women had more sickness benefit days than men of the same age, in several cases twice as many.
Sickness beneft rate 2.0, by age, 2023
A person unable to work due to illness can receive sickness benefit. A person on sick leave can also receive a rehabilitation allowance, for example, for a period of job training, participation in a vocational rehabilitation programme or training.
In 2023, 63 per cent of those who received sickness and rehabilitation allowance were women and 37 per cent were men.
People who received sickness beneft and rehabilitation allowance, 1999–2023
In ongoing cases receiving sickness benefit, rehabilitation allowance or occupational injury benefit, more women then men had been sick for more than 180 days. This pattern has persisted since the mid-1980s. In December 2023, around 107,000 women and 57,000 men were on sick leave for more than 60 days.
Number of ongoing sickness cases, 1974-2023
Stress is one of the causes of sick leave. Since the mid-2000s, the number of ongoing cases of sickness due to adjustment disorders and reactions to severe stress has increased, especially for women. In December of 2023, 79 per cent of people on sick leave with this diagnosis were women and 21 per cent were men.
Ongoing sickness cases due to stress, 2005–2023
Remaining years of life
Women tend to live longer than men. In 2023, a 16-year-old woman is expected to live for about 69 more years. A 16-year-old man is expected to live for about 66 more years. It is estimated that women will live with disability for five more years than men, which roughly corresponds to the difference in the number of additional years of life remaining to women.
This means that, although women are expected to live longer than men, on average they can expect to live more years than men with reduced activity capacity.
Remaining years with and without reduced activity capacity, 2023
| Aptitude for activity | 16 yeras | 30 years | 65 years | |||
| Women | Men | women | Men | Women | Men | |
| Without reduced activity capacity | 50,7 | 52,4 | 40,1 | 40,7 | 14,2 | 13,4 |
| With reduced activity capacity | 18,4 | 13,5 | 15,3 | 11,6 | 7,9 | 6,3 |
of which with seriously reduced activity capacity |
3,9 | 3,2 | 3,4 | 2,8 | 2,2 | 1,6 |
| Total | 69,2 | 65,9 | 55,4 | 52,3 | 22,1 | 19,7 |
Self-reported health
The National Public Health Survey, "Health on Equal Terms?", allows people to self-assess their health. Between the ages of 16 and 65, a minimum of approximately 70 per cent of women and men report good or very good health.
For both women and men, the proportion of people who rate their health as good or very good decreases with age.
In all age groups, more men than women rate their health as good or very good. The proportion of men aged 45-64 who consider themselves to be in good health is about the same as the proportion of women aged 16-29.
People aged 16 and over in good or very good health, by age, 2024
There were very small differences between the proportion of women and men who assessed their health as poor or very poor in 2024.
People aged 16 and over in poor or very poor health, by age, 2024
The proportion of people in good health increases with the level of education. This means that more people with post-secondary education perceive their own health as good, compared to people with compulsory education only. Within these groups, men perceive themselves to be in better health than women. The group where the largest proportion, over 80 per cent, perceive their own health as good or very good, is men with post-secondary education. The group where the smallest proportion of people, just over 50 per cent, perceive their own health as good or very good, is women with compulsory education only. Women with compulsory education only is also the group where the proportion who deem their own health to be poor or very poor is greatest.
Self-reported health of people aged 25–84 by level of educational attainment, 2024
Anxiety, worry, fear and loneliness
Anxiety disorders have increased among both women and men over a ten-year period. Young people aged 16-29 experience problems in this area to the greatest extent. Among young women aged 16-29, problems with anxiety, fear and worry have increased over time. n 2024, 75 percent of that group experienced such issues. Among young men aged 16-29, approximately 45 percent experience these issues, an increase of about 10 percentage points over ten years.
In all age groups, a greater proportion of women experience problems with anxiety, fear and worry than men of the same age. The group least likely to experience problems with anxiety, fear and worry is men aged 65-84.
Women aged 16 and older troubled by anguish, worry or anxiety
Men aged 16 and older troubled by anguish, worry or anxiety
When women and men are asked to assess their problems with loneliness and isolation, older women and young people stand out. In the group of women aged 85 and over, about 40 per cent experience moderate problems with loneliness and isolation. Among young women and men aged 16-29, over 30 per cent experience moderate problems with loneliness and isolation. Young women and men are also the group most likely to experience acute problems with loneliness and isolation.
The group least likely to experience problems with loneliness and isolation is men aged 65-84.
Problems with loneliness and isolation for people 16 years and older by age, 2022
Mortality rates and causes of death
The most common cause of death in 2023 for both women and men was tumours. However, for men with compulsory education only, cardiovascular disease was about equally common as a cause of death. There are differences in causes of death between men and women, and education level is also an influencing factor. For example, the group men with compulsory education only had the highest rate of deaths from suicide or event of undetermined intent. Women with post-secondary education were the group least likely to have the same cause of death.
Cause of death among women aged 35–84, by level of educational attainment, 2023
| Cause of death | Women | ||
| Compulsory | Upper secondary | Post-secondary | |
| Respiratory illnesses | 102,1 | 64,5 | 29,8 |
| Cardiovascular diseases | 227,4 | 167,8 | 102,3 |
| Suicide and damage event with unclear intent | 18,8 | 14,3 | 8,7 |
| Injury and poisonings ex. suicide and dam-age event with unclear intent |
29,4 | 22,3 | 13,6 |
| Tumours | 344,8 | 296,7 | 227,1 |
| Other | 230,3 | 151,3 | 92,2 |
| Total | 1 040,9 | 790,8 | 535 |
| of which | |||
| alcohol-related deaths | 26,4 | 21,7 | 10,6 |
| Covid-19 | 15,6 | 12,3 | 7 |
Cause of death among men aged 35–84, by level of educational attainment, 2023
| Cause of death | Men | ||
| Compulsory | Upper secondary | Post-secondary | |
| Respiratory illnesses | 106,7 | 71,9 | 37,9 |
| Cardiovascular diseases | 391,7 | 296,8 | 183,4 |
| Suicide and damage event with unclear intent | 38,8 | 31,6 | 20 |
| Injury and poisonings ex. suicide and dam-age event with unclear intent |
68,7 | 47,0 | 28,9 |
| Tumours | 391,6 | 346,7 | 263,7 |
| Other | 305,6 | 241,5 | 156,4 |
| Total | 1 396,8 | 1 124,2 | 759,1 |
| of which | |||
| alcohol-related deaths | 73,9 | 62,6 | 28,9 |
| Covid-19 | 30,3 | 22,8 | 16,4 |
By the end of the 19th century, over 100 girls out of every 1,000 born and over 120 boys out of every 1,000 born died in the first year of life. It was not until around 1970 that the infant-mortality rate fell below 10 girls and 10 boys per 1,000 births.
In 2023, 1.76 girls and 2.4 boys out of every 1,000 born died in the first year of life.
Infant mortality, 1885–2023
Maternal mortality
In 2023, three women died from complications during pregnancy or delivery. That year, 100,051 children were born.
Source: Causes of death, National Board of Health and Welfare
Elderly care
In 2023, half of all women and around a third of all men aged 80 and over received help from the authorities in the form of specialised housing or home-care services.
People aged 65 years and older in nursing homes, and with home help in regular housing, by age, 2023 age
| Nursing home, women | Nursing home, men | Home help in regular housing , women | Home help in regular housing, men | |
|---|---|---|---|---|
| 65-79 | 1,6 | 1,6 | 5,2 | 4,6 |
| 80+ | 17,0 | 10,9 | 32,7 | 24,5 |
| 65+ | 6,2 | 3,9 | 13,5 | 9,5 |
Child carer’s allowance and benefit for care of closely related persons
Child carer’s allowance is a benefit for parents whose child has a special need for care and supervision due to a disability. Both parents of the child can receive nursing allowance, and the main rule is that the allowance is divided equally between the parents. If the parents agree, they can decide how to distribute the allowance.
Of parents receiving child carer’s allowance in December of 2023, 78 per cent were women and 22 per cent were men.
Parents in receipt of child carer’s allowance allowance, 2023
Benefit for care of closely related persons is a financial aid for people who give up work to care for a seriously ill person at home, in a hospital or other care facility.
In 2023, 72 per cent of the persons who received benefit for care of closely related persons were women and 28 per cent were men. The gender breakdown of carers receiving benefit for care of closely related persons has remained unchanged for many years at around 70 per cent women and 30 per cent men.
People with benefts for care of a close relative, 2000–2023
Education

Women and men, girls and boys must have the same opportunities and conditions regarding education, study options and personal development.
Gender equality in education is the third gender-equality policy sub-goal. It states that women and men must have equal opportunities and conditions in education, choice of study and personal development.
Schools play an important role in creating an equal society and countering traditional gender patterns. Gender equality in education covers the entire formal education system, from pre-school to adult education, higher vocational education and training, universities and colleges. It also includes education outside the formal system, such as folk high schools and the educational activities of adult educational associations.
Girls and boys, women and men, often study in different programmes, and few programmes have a equal gender distribution. These educational choices affect future careers and thus opportunities for livelihood, independence and empowerment.
Gender equality in schools is not only about educational choices, but also about how girls and boys, women and men, perform, their well-being and their experiences of the school environment.
Child care
The 1970s saw the start of an expansion of publicly funded child care. In 1972, 12 per cent of all children of pre-school age were enrolled in pre-school, educational care or after-school centre. In 2021, the corresponding share was 86 per cent. At the same time, the share of women in the labour force increased significantly in the 1970s and 1980s. (Data for 1972 are for municipalities and data for 2021 are for municipalities and private organisations.)
Preschool, pedagogical care and recreation centres 1972–2023 under municipal management
Grades
Girls, as a group, have higher grades than boys, both in primary and secondary school.
Both girls' and boys' merit ratings in year 9 in primary school have increased over time. In 1998, girls had an average merit rating of 212.0 and boys 190.9. Since then, the merit ratings have increased to 228.4 for girls and 211.6 for boys in 2024. The maximum possible merit rating is 320 points.
Grade point average for pupils who completed the ninth grade, 1998–2021
In both primary and secondary school, students of Swedish heritage have higher grade points than students of foreign heritage. Here, too, there are differences between girls and boys. Girls of Swedish heritage have the highest grades and boys of foreign heritage are the group with the lowest grades.
Spread of grade point average for pupils who completed the ninth grade by Swedish/foreign background, 2021


In upper-secondary education, the maximum possible final school grade is 20. In the 22/23 academic year, girls scored an average of 15.1 points and boys 13.9 points in their final school grade.
Grade points for students in upper secondary school with final grades, by Swedish and foreign background, 2022/23
| Women | Men | |
|---|---|---|
| Swedish background | 15,4 | 14,2 |
| Foreign background | 14,1 | 12,9 |
| Total | 15,1 | 13,9 |
Stress at school
More girls than boys say they are often stressed due to homework or exams. Just over half of girls and a quarter of boys aged 12 to 18 say they are stressed due to homework or exams. This applies to both primary and secondary school.
Children aged 12–18 who state they are often stressed due to homework or tests, 2023
Pupils in upper-secondary schools
In the 22/23 academic year, four national upper-secondary school programmes had an equal gender distribution: Restaurant and Food, Commerce and Administration, Natural Sciences and Economics.
In the 22/23 academic year, 54 per cent of women attended predominately female programmes and 44 per cent of men attended predominately male programmes. 38 per cent of females and 33 per cent of males attended gender-balanced programmes.
Upper secondary school graduates by programme or attachment to programme, 2022/2023

Among pupils with parents who did not complete upper-secondary school, 58 per cent of women and 67 per cent of men of Swedish heritage chose to attend vocational programmes. For students of foreign heritage whose parents had only compulsory education, 34 per cent of women and 48 per cent of men chose vocational programmes.
Among students with parents who have post-secondary education, only 22 per cent of women and 30 per cent of men of Swedish heritage chose a vocational programme. For pupils of foreign heritage, the proportion was even lower: 13 per cent for women and 21 per cent for men.
Pupils in upper secondary school, by programme and parents’ level of educational attainment and Swedish/foreign background, 2023/2024
| Parents with no more than compulsory education | ||||
| Pupils’ programme | Swedish background |
Foreign background |
||
| Women | Men | Women | Men | |
| Higher education preparatory programmes |
43 | 33 | 66 | 53 |
| Vocational programme | 58 | 67 | 34 | 48 |
| Number | 1 350 | 1 360 | 5 960 | 6 040 |
| Parents with no more than upper secondary education | ||||
| Pupils’ programme | Swedish background |
Foreign background |
||
| Women | Men | Women | Men | |
| Higher education preparatory programmes |
51 | 38 | 77 | 64 |
| Vocational programme | 49 | 62 | 23 | 36 |
| Number | 35 000 | 36 300 | 13 320 | 13 500 |
| Parents with post-secondary education | ||||
| Pupils’ programme | Swedish background |
Foreign background |
||
| Women | Men | Women | Men | |
| Higher education preparatory programmes |
79 | 70 | 87 | 79 |
| Vocational programme | 22 | 30 | 13 | 21 |
| Number | 83 480 | 88 190 | 18 980 | 19 890 |
Of the pupils of foreign heritage who commenced upper-secondary studies in 2019, 30 per cent of women and 40 per cent of men have not completed their upper-secondary education. For pupils of Swedish heritage, the corresponding figures are 13 per cent for women and 15 per cent for men.
Pupils who began upper secondary school in the autumn of 2019 and who did not completed their education within four years, by Swedish and foreign background
| Background | Number of enrolments | Percentage failing to complete | ||
| Women | Men | Women | Men | |
| Swedish background | 40 610 | 42 730 | 13 | 15 |
| Foreign background | 14 230 | 16 040 | 30 | 40 |
| Total | 54 870 | 58 800 | 18 | 22 |
University and college students
There are more women than men studying at universities and colleges. In 1977, a higher-education reform was implemented. It expanded the scope of first-cycle academic education to include teacher and nurse training programmes, among others. As these were predominately female programmes, the reform contributed to a greater proportion of women in higher education than men, and this pattern has continued ever since, with approximately 60 per cent women and 40 per cent men.
Enrolled students academic years, 1977/78–2022/23
The transition from first to second cycle differs between women and men. Of graduates at first- and second-cycle level, a greater proportion of men start a third-cycle programme than women.
In 1986, 24 per cent of doctoral graduates were women and 76 per cent were men. The proportion of women has increased over time, and since 2001 there has been a gender balance among doctoral graduates. As of 2023, half are women and half are men.
Students and graduates from higher education in 1985/86, 1999/00 and 2022//23
| 1985/86 | 1999/00 | 2022/23 | ||||
| Women | Men | Women | Men | Women | Men | |
| Undergraduate and graduate level | ||||||
| Entering higher education | 58 | 42 | 58 | 42 | 58 | 42 |
| Students | 57 | 43 | 59 | 41 | 62 | 38 |
| Graduates | 66 | 34 | 60 | 40 | 64 | 36 |
| Postgraduate level1 | ||||||
| New doctoral students | 31 | 69 | 45 | 55 | 52 | 48 |
| Doctoral students | 30 | 70 | 44 | 56 | 53 | 47 |
| Licentiate degree | 22 | 78 | 37 | 63 | 43 | 57 |
| PhD degree | 24 | 76 | 39 | 61 | 50 | 50 |
Popular education
Women participate in popular education at a much higher rate than men. Sixty-five per cent of participants in popular-education activities in 2023 were women and 35 per cent were men. This pattern is similar for both native and foreign-born women and men. The minimum age for participating in a study circle is 13, but children under 13 can also participate in other popular-education activities.
Participants in popular education by Swedish/foreign background, 2023
Personnel
The gender balance of education-system personnel has long been uneven, with a strong female predominance in early childhood education and a male predominance among university professors. In pre-schools, this imbalance is still evident, with 96 per cent of staff being female and 4 per cent male. However, the gender balance among professors has become slightly more even. As of 2023, women make up 31 per cent of professors, while men make up 69 per cent.
Educational care was also predominately female, with 98 per cent women and 2 per cent men in municipal educational care in 2023. The greatest proportion of men was found among personnel in private after-school centres, where 63 per cent of personnel were women and 37 per cent men.
Staff in preschool, recreation centres and pedagogical childcare, by form of operation, 2023
| Number | Sex distribution | |||
| Women | Men | Women | Men | |
| Municipal preschool | 74 500 | 3 000 | 96 | 4 |
| Preschool under private management | 20 300 | 1 200 | 95 | 5 |
| Municipal recreation centre | 14 100 | 6 500 | 68 | 32 |
| Recreation centre under private man-agement |
1 800 | 1 100 | 63 | 37 |
| Pedagogical childcare under municipal management |
400 | 0 | 98 | 2 |
| Pedagogical childcare under private management |
800 | 0 | 94 | 6 |
In primary and lower-secondary schools, 75 per cent of teachers were female and 25 per cent male in academic year 23/24. Compared to the 85/86 academic year, the proportion of women has increased from 68 per cent, while the proportion of men has decreased from 32 per cent. The gender balance of head teachers has also changed significantly since 85/86. At that time, only 19 per cent of head teachers were women and 81 per cent were men. In academic year 23/24, 73 per cent of head teachers were women and 27 per cent were men.
In upper-secondary schools, the gender balance was even, both among teachers and head teachers. In academic year 23/24, 53 per cent of teachers were women and 47 per cent were men. For head teachers, 57 per cent were women and 43 per cent were men. Upper-secondary schools have also seen major changes since the 1980s, when only 29 per cent of head teachers were women and 71 per cent were men.
Teachers and school leaders in compulsory and upper secondary schools, 1985/86, 2000/01 and 2023/24
| Sex distribution | ||||||
| 1985/86 | 2000/01 | 2023/24 | ||||
| Women | Men | Women | Men | Women | Men | |
| Teachers | ||||||
| Compulsory school | 68 | 32 | 73 | 27 | 75 | 25 |
| Upper secondary school | 44 | 56 | 48 | 52 | 53 | 47 |
| Principals | ||||||
| Compulsory schoo | 19 | 81 | 62 | 38 | 73 | 27 |
| Upper secondary school | 29 | 71 | 34 | 66 | 57 | 43 |
| Other school leaders | ||||||
| Compulsory school | .. | .. | 68 | 32 | 76 | 24 |
| Upper secondary school | .. | .. | 44 | 56 | 61 | 39 |
Among academic staff in higher-education institutions, one third of professors were women and two thirds were men in 2022. This means that there was a significant gender gap at the highest academic level. In contrast, the gender distribution in the other categories of academic staff was even, although there were more men in all but one position. The exception was lecturers, where women accounted for 62 per cent and men 39 per cent in 2022.
Teaching and research staff, by employment category, 2022
Women have always been under-represented among the country's professors, and this employment category still has the lowest proportion of women in higher education. In 2001, the proportion of women among professors was 14 per cent. By 2022, the proportion had increased to 31 per cent.
Professors 2001-2022
Parental benefit
In 1974, Sweden became the first country in the world to introduce a public parental allowance, enabling both women and men to take time off work to care for their newborn children. This reform replaced the previous maternity insurance and was introduced at the same time as other important gender-equality reforms, such as individual taxation and the expansion of child care. The aim was to increase women's participation in the labour market and to make it possible to combine work with parenthood. The father's role in caring was also emphasised, and, later, children's needs for security and attachment have been highlighted.
Today, the Parental Leave Act gives parents the right to take full leave from work until the child is 18 months old, whether or not they receive parental allowance. Parental leave can be used for continuous periods, single days or parts of days, making it possible to alternate paid and unpaid leave and extend the time at home with the child.
Temporary parental allowance was introduced in 1978 and is often referred to as leave for care of a child, or vab. This permits parents to receive an allowance while staying home from work to care for sick children.
The right to take time off work and receive compensation for lost earnings has been crucial for both women and men to combine work with parenthood. Read more in the chapter Parental Insurance 1974-2024 about the history of parental insurance and how it has developed since its introduction.
In this chapter, we take a closer look at how parental allowance is distributed between women and men.
Parental allowance
After the introduction of the parental allowance in 1974, fathers' take-up was very low, with less than 1 percent of days taken by men. In 1995, the first so-called 'father's month' was introduced, which meant that 30 days were reserved for each parent and could not be transferred. From 2002, 60 days were reserved for each parent, and from 2016 this was increased to 90 days. Men's take-up of parental allowance then increased, to approximately 30 percent around 2016-2017, and has since remained at that level.
Days for which parental beneft is paid, 1974-2023
Women have taken up around 70 percent and men 30 percent of parental-allowance days since 2017, but the total number of parental-allowance days taken up has decreased. Women took up about one fifth fewer parental-allowance days in 2023 compared to 2017, making 2023 the year with the lowest take-up in over 20 years. For men, the decrease is not as large, and men still took up more parental-allowance days in 2023 than ten years ago.
Days for which parental beneft is paid, 1993-2023
Parents take up parental allowance to different extents, depending on the age of the child. The younger the child, the less equal the take-up of parental allowance. For children born in 2015, women took up 88 percent of parental-allowance days and men took up 12 percent during the child's first year of life. During the child's second year, the situation evens out somewhat. At that time, women took up 58 percent and men took up 42 percent.
Not until the child is five years old do women and men take up the same number of parental leave days, on average five days per year.
Days for which parental beneft is paid, by age attained among children born in 2015
| Attained age of child | Number of days | Percentage | |||
| Women | Men | Total | Women | Men | |
| 0 | 8 | 0 | 8 | 100 | 0 |
| 1 | 204 | 27 | 231 | 88 | 12 |
| 2 | 57 | 42 | 98 | 58 | 42 |
| 3 | 12 | 10 | 23 | 55 | 45 |
| 4 | 19 | 17 | 36 | 54 | 46 |
| 5 | 5 | 5 | 10 | 50 | 50 |
| 6 | 3 | 4 | 7 | 48 | 52 |
| 7 | 3 | 3 | 7 | 48 | 52 |
| 8 | 3 | 3 | 7 | 48 | 52 |
| Total | 315 | 111 | 426 | 74 | 26 |
To illustrate how parents take up parental allowance from a child's perspective, the percentage of children whose parents share parental allowance equally is shown. Equal take-up means that the parents have each taken up between 40 and 60 percent of the parental-allowance days when the child turns two.
For children born in 2005, only one in ten children had parents who shared parental benefits equally. This share has slowly increased since then, and for children born in 2021, slightly more than one in five children had parents who shared parental benefits equally.
Proportion of children whose parents have shared parental benefit equally, by year of birth
Care of a sick child (vab)
Women have been taking more care of a sick child days, also known as vab, every year since this option was introduced, in the late 1970s. However, the distribution of vab days has always been more equal than the take-up of parental allowance. For example, in 1980, women took up 95 percent of all parental-allowance days and men 5 percent, while for vab the split was 63 percent for women and 37 percent for men.
In 2023, three out of five vab days were taken up by women and two out of five by men. Since 2015, men's share of vab days has remained just below 40 percent, and in 2021 it reached 40 percent. However, in the last two years, the gender breakdown has fallen back to just below 40 percent for men and just above 60 percent for women.
Days for which temporary parental beneft is paid, 1980–2023
During the pandemic years 2020-2022, the number of days taken for care of a sick child increased to historically high levels, as both women's and men's take-up increased drastically. The gender distribution of vab days remained constant during these years, but due to the large increase in the number of days, the difference in days taken up between women and men grew compared to previous years.
In 2019, before the pandemic restrictions, women took up around 1.5 million more days of leave than men. During the pandemic years 2020-2022, this increased to women taking up on average around 1.8 million more days per year than men.
Days for which temporary parental beneft is paid, 2006-2023
Unpaid household and care work
Women and men must have the same responsibility for unpaid housework and have the opportunity to give and receive care on equal terms.
Equal distribution of unpaid housework and care work is the fourth gender-equality policy sub-goal. The aim of understanding and measuring this work is to shed light on the everyday activities that shape the lives of women and men. This includes everything from cleaning, shopping and car repairs to caring for children, the sick and relatives. By studying who performs these tasks and how much time is spent, a clearer picture of how the workload is distributed in the home can emerge.
Statistics on unpaid labour are often difficult to collect and report. Housework is seen as part of everyday life and differs from paid work in that it is not recorded in any system, but is more or less explicitly distributed among household members. Often it is not even possible to measure the time it takes to perform many of the chores. For example, buying a pair of trousers for children is an activity that can be estimated in terms of time, whereas planning the purchase by comparing prices, researching quality and keeping track of the child's size is an expenditure of time and exercise of responsibility that is more difficult to measure. Caring for an ageing partner, instead of using home-care services, is another example of unpaid domestic work that is difficult to measure; instead we must analyse who actually uses home-care services, in order to form an opinion on who does not.
Statistical surveys measuring unpaid work tend to be expansive and very demanding for participants, often leading to high non-response rates.
Despite such challenges, measuring unpaid housework and care work is important because it is a fundamental part of society. A balanced distribution of unpaid work is therefore crucial to ensure that both women and men have equal opportunities to maintain social contacts, progress in the labour market and engage in voluntary or political activities in their free time.

Caring for children
It is possible to take parental leave without receiving parental allowance. According to the Swedish Social Insurance Agency's model, women are estimated to be on unpaid parental leave for about 33 percent of the time, and men for 27 percent of the time, until their children reach the age of two. In terms of days, this means that women were expected to take an average of 122 days of parental leave without parental allowance and men 36 days.
Days compensated with parental allowance and number of days without parental allowance during parental leave for children aged 0-2 years born in 2021
Time use
Women experience more stress due to being too busy compared to men. This applies whether they are single or cohabiting and whether they have children.
Among single women with children, 41 percent feel stressed because they are too busy. For cohabiting women with children, a slightly smaller proportion, 39 percent, experience stress.
Among single men with children, 28 percent feel stressed because they are too busy, and this is the most stressed group among men. Of men who are cohabiting and have children, 23 percent feel stressed.
Single women without children are more likely to feel stressed than cohabiting men with children.
People aged 20–64 who often feel stressed due to having too much to do by type of household, 2021
Women generally spend more time than men on activities such as cooking, cleaning, washing and caring for their own children (feeding, dressing, hygiene, bedtime). This is the case regardless of women’s income, age, employment status, cohabitant status, or whether they have children. Men generally spend more time than women on gainful employment, home maintenance and repairs and vehicles. For activities such as gardening and grocery-shopping, women and men spend about the same amount of time. This also applies to certain activities linked to their own children, such as helping with homework, attending children's activities, family activities and reading and playing. The time spent on activities related to caring for others also does not differ between genders. In contrast, women spend more time in contact with family and friends than men.
Women aged 18-84 years cook for 1 hour and 24 minutes on average per day. The corresponding figure for men is slightly more than an hour. Cooking also includes baking and setting the table. Women spend more time cleaning than men. On average, women spend 54 minutes per day cleaning compared to 34 minutes for men. Cleaning also includes activities such as washing dishes, making beds, emptying rubbish and tidying up the home. Time use differs between genders in doing laundry. Women do laundry for 25 minutes a day while the corresponding figure for men is 12 minutes. This category also includes other forms of clothing maintenance, such as mending and ironing as well as textile care.
Men spend more time managing household finances. They spend an average of 16 minutes a day on this activity, while women spend 9 minutes.
Source: SCB 2022, En fråga om tid (TID2021) En studie av tidsanvändning bland kvinnor och män 2021
Time spent on unpaid household and care work, by different activities for people aged 20–64, 2021

Gainful employment

Economic gender equality. Women and men must have the same opportunities and conditions for paid work that provide economic independence throughout life.
Economic equality is the second gender-equality policy sub-goal.
Economic equality is influenced by several factors, such as labour-market conditions, education, tax and pension systems, and unpaid housework and care work. Rights such as not having to risk injury or death in the workplace, as well as being protected from sexual assault, are also central to promoting gender equality in the labour market. A job that offers secure and fair conditions enables both women and men to work on equal terms until retirement age.
Women and men work to a large extent in different occupations. Across the labour market, only 23 percent of employed women and 17 percent of employed men worked in gender-balanced occupations in 2022. Women also work part-time to a greater extent than men, take up most of the parental allowance and child care days, and have more sick days than men, which together leads to women working fewer paid hours than men.
This chapter on the labour market contains statistics on the labour market, working hours and self-employment. It also includes statistics on the working environment and statistics on employed persons with disabilities.

Terms
In this section, a number of terms appear that are explained below.
The labour force includes people who are either employed/gainfully employed or unemployed.
Not in the labour force refers to people who are not employed and not looking for work.
Employed refers to people who have gainful employment for at least one hour in the reference week or who have been temporarily absent from work.
Unemployed are individuals who are not employed and who have looked for work and been able to work. People who have got a job that they will start within three months are also counted as unemployed, provided that they had been able to work during the reference week or start work within two weeks thereafter.
The employment rate is the proportion (%) of the population in employment.
Time actually worked is the number of hours a person worked during the reference week.
Hours normally worked is to the working time the person was supposed to work as agreed.
Agreed working time is based on the number of hours a person has as agreed working time.
Absent refers to individuals who have a job, but have not performed that job because of holiday, illness, parental leave, studies, etc.
The economic activity rate is the proportion (%) of the population in the labour force.
The unemployment rate is the proportion (%) of the labour force that is unemployed.
Latent job-seekers refers to people who are able and willing to work, but who have not looked for work. Latent job seekers are not included in the labour force.
The underemployed are people wishing to increase their working hours and who can start to work more.
Since 2005, individuals who are registered in Sweden and work abroad are defined as employed in the Labour Force Surveys. Previously, these individuals were not included in the labour force. Since 2007, individuals who are full-time students and who have looked for work and have been able to work are defined as unemployed. The changes that occurred implied that there were time series breaks, but the tables and figures have been recalculated back to 1987. This is illustrated in the diagrams concerned with a vertical line. In January 2021, the Labour Force Survey was adapted to the EU’s new social statistics regulation, which has caused a break in the time series. These statistics are intended to reflect the labor force and therefore cover the age group 20–64 years up to and including the reference year 2022. From the reference year 2023 onwards, the age group 20-65 years is included. The difference is due to a change in the age limit in the pension system.
Labour market
Population aged 20–65 in and not in the labour force, 2023

There is a clear correlation between level of education and labour-market position, with those who have compulsory education only more often occupying a weaker position. This applies to both native and foreign-born persons and regardless of gender.
Among women aged 25-65 with compulsory education only, slightly more than one in two of those born in Sweden, and around one in three of those born abroad, were employed. At the same time, unemployment, i.e. those willing and able to work, among women with compulsory education only was clearly higher among foreign-born women. Among men with compulsory education only, employment is higher than among women.
Eight out of ten men born in Sweden were in employment, and around half of men born abroad. As with women, foreign-born men were more likely to be unemployed than native-born men. However, the comparison is affected by the fact that the foreign-born are on average younger than the native-born.
Employment, unemployment and activity rate among people aged 25–65 by level of educational attainment and Swedish/foreign-born, 2023
| Level of educational attainment |
Employment rate1 |
Unemployment rate2 |
Economic activity rate3 |
|||
| Born in Sweden |
Born abroad |
Born in Sweden |
Born abroad |
Born in Sweden |
Born abroad |
|
| Women | ||||||
| Compulsory | 58 | 36 | .. | 41 | 65 | 62 |
| Upper secondary | 79 | 68 | 3 | 16 | 82 | 81 |
| Post-secondary | 81 | 2 | 10 | 92 | 89 | |
| n/a | .. | .. | .. | .. | .. | .. |
| All | 86 | 70 | 3 | 15 | 88 | 83 |
| Men | ||||||
| Compulsory | 73 | 66 | 6 | 24 | 78 | 87 |
| Upper secondary | 87 | 79 | 3 | 14 | 90 | 92 |
| Post-secondary | 91 | 88 | 2 | 8 | 93 | 95 |
| n/a | .. | 75 | .. | .. | .. | 84 |
| All | 88 | 81 | 3 | 12 | 91 | 93 |
The percentage of women in the labour force rose sharply in the 1970s and 1980s. A large part of this increase can be explained by an increase in women with long part-time employment. In the 1990s, the percentage of people unemployed increased and, to a certain extent, so did the percentage of women outside the labour force. Unemployment had decreased once more in the early 2000s, but the proportion of unemployed women remained higher than in the 1970s and 1980s. Roughly explained, and with variations over the years, the proportion of women with full-time employment has continued to rise. At the same time, the proportion of women aged 20–64 in the population with part-time employment has dropped in recent decades.
Women aged 20–64 by labour force status and hours normally worked, 1970–2020
The percentage of men in the labour force was essentially constant in the 1970s and the 1980s. In the 1990s, the unemployment rate rose among men, while the percentage of men outside the labour force also increased slightly. In the early 2000s, the percentage of unemployed men had decreased, although the percentage of those unemployed remained higher than in the 1970s and 1980s. The percentage of men working full-time or part-time has not changed signifIcantly in recent years. However, considering the trend in the most recent decades, the percentage of men working part-time has increased slightly.
Men aged 20–64 by labour force status and hours normally worked, 1970–2020
Due to changes in the Labour Force Surveys, labour-force participation in 2023 is reported for agreed time, instead of hours normally worked.
Labour force status and agreed working time among people aged 20-65, 2023
| Women | Men | |
|---|---|---|
| Full-time 35- hours | 61 | 74 |
| Long part-time 20-34 hours | 12 | 6 |
| Short part-time 1-19 hours | 4 | 2 |
| Unemployed | 6 | 6 |
| Not in the labour force | 15 | 10 |
Percentage of population in the labour force and percentage of labour force unemployed
The percentage of population in the labour force is the proportion of the labour force that is employed, and the percentage of labour force unemployed is the proportion of the labour force that is unemployed. In 2023, the percentage of population in the labour force for the 20-65 age group was 85.2 percent for women and 89.9 percent for men. The percentage of labour force unemployed for the same age group was 6.7 percent for women and 6.4 percent for men.
The percentage of labour force unemployed for women and men follow broadly similar patterns over time. In both groups, unemployment increased during the economic crisis of the 1990s and has not returned to the lower levels of previous years since then. Among both women and men, the percentage of labour force unemployed is highest at younger ages.
Relative unemployment rate among women by age, 1970–2023
Relative unemployment rate among men by age, 1970–2023
Opportunity to work from home
Across all sectors, men and women work from home about equally. In terms of sectors, working from home is most common in the public sector. In 2023, more women in the public sector worked from home to some extent, 64 percent, compared to 49 percent of men. In the private and municipal sectors, the differences between women and men's opportunities to work at home are small.
The occupations where working from home was most common in 2023 were managerial occupations. Eighteen percent of managers worked from home at least half of their working days, and 43 percent said they worked from home for less than half of those days. About the same proportion of women as men in managerial occupations worked from home.
Source: Labour Force Survey (LFS), published in Women and men in Sweden 2024, Statistics Sweden
Gender breakdown of the labour market
Among the 30 largest occupations five had an equal sex distribution; that is, there were 40–60 percent women and 40–60 percent men. These were: Management and organisation
developers Cooks and cold-buffet staff, Restaurant and kitchen workers, etc, Customer service staff and Shop sales, speciality stores.
The most female-dominated occupation out of the 30 largest occupations in 2022 was Preschool teachers, with 96 percent women and 4 percent men. The most male-dominated
occupation was Woodworkers, carpenters, etc. with 2 percent women and 98 percent men.
The 30 largest occupations, 2022

In 2022, 23 percent of employed women and 17 percent of employed men were working in gender-balanced occupations in the labour market as a whole.
Both women and men were most likely to work in occupations where their own sex predominated, with 62 percent of women working in predominately female occupations and 64 percent of men working in predominately male occupations. Slightly more men worked in predominately female occupations than women worked in predominately male occupations.
Employees by sex distribution in the occupation, 2022
| Occupations with | Women | Men |
| 90-100 % w, 0-10 % m |
11 | 1 |
| 60-90 % w, 10-40 % m |
51 | 18 |
| 40-60 % w, 40-60 % m |
23 | 17 |
| 10-40 % w, 60-90 % m |
14 | 45 |
| 0-10 % w, 90-100 % m |
1 | 19 |
| All | 100 | 100 |
Under 1970- och 1980-talen ökade antalet kvinnor på arbetsmarknaden. Detta framförallt till följd av att antalet kvinnor i kommunal sektor fördubblades. Under 1980- och 1990-talen arbetade ungefär lika många kvinnor i kommunal som i privat sektor. Idag arbetar dock den största andelen av kvinnorna i privat sektor. Under hela tidsperioden har män till största delen arbetat i privat sektor. Minskningen i statlig sektor beror delvis på personalminskningar men också på bolagiseringen av flera statliga verk under 1990-talet. Anställda där räknas därefter in i privat sektor.
Employed women aged 20–64 by sector, 1970–2020
Employed men aged 20–64, by sector, 1970–2023
Working hours
More women than men work part-time. Twenty-six percent of women and 11 percent of men in employment aged 20-65 worked part-time in 2023.
Employed people aged 20–65 who work full-time and part-time, 2023
Reasons for part-time work among people aged 20–65, 2023
For employed men who have children, the differences in working hours are not so great. Most of them work full-time, no matter how old their children are or how many children they have. But for women it is different. Even with one child, more women work part-time than men. For women with three children, over 36 percent work part-time when the youngest child is 1-2 years old. Even when the youngest child is between 11 and 16 years old, women with three children are more likely to work part-time compared to women with fewer children.
Employed parents aged 20–65 with children at home aged 16 years and younger, by number of children, the youngest child’s age and length of working hours, 2023
| Number of children | Women | Men | ||
| Youngest child’s age | Full time |
Part time |
Full time |
Part time |
| 1 child | ||||
| 0 years | 85 | .. | 91 | .. |
| 1-2 years | 71 | 29 | 89 | 11 |
| 3-5 years | 71 | 29 | 91 | 9 |
| 6-10 years | 78 | 22 | 95 | .. |
| 11-16 years | 81 | 19 | 94 | 6 |
| 2 children | ||||
| 0 years | 75 | 25 | 91 | .. |
| 1-2 years | 67 | 33 | 92 | 8 |
| 3-5 years | 71 | 29 | 91 | 9 |
| 6-10 years | 74 | 26 | 94 | 6 |
| 11-16 years | 79 | 21 | 96 | 5 |
| 3 children or more | ||||
| 0 years | 78 | .. | 91 | .. |
| 1-2 years | 64 | 36 | 92 | .. |
| 3-5 years | 69 | 31 | 94 | .. |
| 6-10 years | 74 | 26 | 95 | .. |
| 11-16 years | 75 | .. | 92 | .. |
Holidays were the most common reason for whole-week absences for women as well as men without children. However, a different pattern emerges for women and men with children under age 7. Among men, holidays are still the most common reason, but among women it is child care.
Employed people aged 20–64 who have been absent the entire week, by reason, 2023
| Women, all | Men, all | Women with children under age 7 | Men with children under age 7 | |
|---|---|---|---|---|
| Sick | 3 | 2 | 3 | 1 |
| Holiday | 9 | 8 | 8 | 9 |
| Care of children | 4 | 1 | 17 | 6 |
| Other | 2 | 2 | 1 | 1 |
| Total | 18 | 13 | 29 | 17 |
Flexible working hours
Around 64 percent of women say that they can control their working hours to some extent, which is less than among men, where the corresponding proportion is 76 percent. The degree of flexibility varies to a great extent depending on sector, occupation and industry.
Approximately 88 percent of employees in the public sector report that they can fully or partially control their working hours, which is more than in the municipal and private sectors, where the corresponding proportion is 55 percent and 68 percent respectively. Employees in occupations requiring higher education are more likely to say that they have full or partial control over their working hours.
Source: Labour Force Survey (LFS), published in Women and men in Sweden 2024, Statistics Sweden
Working environment
When a serious injury or death occurs at a workplace, the employer is obliged, under the Work Environment Act, to report it to the Swedish Work Environment Authority. Work-related injuries affecting several workers at the same time and incidents involving serious risk to life or health must also be reported. The latter category also includes events that have affected someone psychologically, for example if someone has been exposed to harmful stress for a long time and reacted strongly to it.
More information is available from
the Swedish Work Environment Authority.
Reports of work-related illness are more likely to involve women, while men are more likely to suffer accidents leading to sickness absence and death. Most reports of occupational accidents resulting in sickness absence concern young men aged 20 to 24.
In 2023, the number of reported occupational accidents resulting in sickness absence per 1,000 employed persons aged 20 to 24 was 14.5 for men and 10.1 for women. The Swedish Work Environment Authority emphasises that some of the reasons may include poor training and lack of knowledge regarding the importance of work-environment factors.
Source: Fokus på ungas arbetsmiljö, Swedish Work Environment Authority
Reported occupational injuries among employed persons, 2023
| Women | Men | |
|---|---|---|
| Occupational diseases | 12 141 | 4 890 |
| Occupational accidents with sick leave | 15 740 | 21 812 |
| Occupational accidents without sick leave | 37 926 | 34 009 |
| Fatal workplace accidents | 9 | 31 |
Significantly more men than women die in occupational accidents. Over time, deaths among men have declined sharply, while deaths among women have remained relatively constant.
Deaths in occupational accidents, 1955-2023
The Work Environment Survey monitors working conditions in the Swedish labour market. Women are more likely than men to report problems with insomnia, headaches and overwork. Men are more likely to report being exposed to noise, working when they should be on sick leave and doing heavy lifting every day.
Work environment conditions for employed persons aged 20–64, 2021
It is mainly young women aged 16-20 who have been sexually harassed at work at least once in the last 12 months. They are most likely to be victimised by people not employed at their workplace, such as customers, clients, passengers or students.
Subjection to sexual harassment at least once in the past 12 months by age, 2021
Disability
Approximately 14 percent of all employed women and just under 10 percent of all employed men experience discrimination in the workplace. More women than men report having been subjected to violence or threats of violence at least once in the past 12 months: slightly less than a fifth of women and slightly less than a tenth of men.
The statistics for women and men with reduced work capacity due to disability are subject to some uncertainty, but there is a tendency for a higher proportion of women with reduced work capacity to have experienced threats or intimidation in the last 12 months compared to men with reduced work capacity.
Employed persons aged 20-64 years who have experienced violence, threats of violence or personal persecution, by disability and work capacity, 2021
Over 90 percent of women with reduced work capacity due to disability have worked despite illness. More than 70 percent of men in the same group say they have worked despite illness. This is a higher proportion for both women and men compared to all persons in employment.
Among women with reduced work capacity due to disability, 21 percent report working despite illness because they were afraid of losing their job. The corresponding share for men in the same group is 7 percent. Slightly less than two-thirds of women with reduced work capacity report working despite illness because they cannot afford to be ill. The corresponding share for men with reduced work capacity is one third.
Persons with/without disability aged 20-64 who worked at any time in the last 12 months despite illness 2021
| All employed | Persons with disability with reduced work capacity | |||
| Women | Men | Women | Men | |
Worked despite illness |
63 | 52 | 93 | 72 |
| Reason: | ||||
Fears dismissal |
13 | 10 | 21 | 7 |
| Can not afford to be sick | 29 | 21 | 63 | 29 |
One in five women with a disability has fixed-term employment, a slightly higher proportion than men with disabilities. Men without disabilities have the lowest share of fixed-term contracts. Among employed women and men without disabilities, 86 and 88 percent respectively have permanent employment.
Employed persons with/without disability aged 16-65 years by type of employment
Entrepreneurship
More men than women are self-employed. In 2022, approximately 30 percent were women and 70 percent were men. Among women, being self-employed is most common in business services and personal and cultural services etc. Business services are also most common among men, along with the construction industry.
Self-employed, 20 years and older, by industry, 2022
| Number | Percentage distribution | Sex distribution | ||||
|---|---|---|---|---|---|---|
| Women | Men | Women | Men | Women | Men | |
| Personal and cultural services, etc. |
39 | 65 | 20 | 5 | 62 | 38 |
| Health and social care | 32 | 20 | 7 | 2 | 61 | 39 |
| Education | 15 | 40 | 4 | 1 | 56 | 44 |
| Corporate services | 14 | 47 | 25 | 18 | 37 | 63 |
| Hotels and restaurants | 11 | 7 | 4 | 4 | 32 | 68 |
Real estate companies |
6 | 13 | 2 | 2 | 31 | 69 |
| Commerce | 6 | 5 | 10 | 11 | 27 | 73 |
| Agriculture, forestry and fishery | 5 | 22 | 9 | 13 | 23 | 77 |
| Manufacturing, mining and quarrying |
5 | 28 | 3 | 6 | 20 | 80 |
| Information and communication |
4 | 69 | 3 | 8 | 15 | 85 |
| Transport companies | 3 | 8 | 1 | 5 | 7 | 93 |
| Construction industry | 1 | 18 | 3 | 19 | 5 | 95 |
Other industries |
1 | 3 | 1 | 1 | 18 | 82 |
Unknown industry |
14 | 17 | 9 | 5 | 44 | 56 |
| Total | 156 | 362 | 100 | 100 | 30 | 70 |
If one does not include cases in which the industry is unknown, the only industry with an even gender breakdown of self-employed persons is Educational system. Of the other industries, Personal and cultural services, etc., and Health and community care services are predominately female, while the rest are predominately male.
Self-employed, 20 years and older, by industry, 2022
Business operators 20 years and older by number of employees at company and legal form of company, 2022
| Number of gainfully employed |
Women | Men | ||
| Business operator in own limited co |
Selfemployed | Business operator in own limited co |
Selfemployed | |
| 1 | 39 | 66 | 33 | 57 |
| 2-4 | 29 | 5 | 29 | 7 |
| 5-9 | 13 | 1 | 15 | 1 |
| 10-19 | 7 | 0 | 9 | 0 |
| 20-49 | 4 | 0 | 6 | 0 |
| 50- | 4 | 0 | 3 | 0 |
| Totalt percent | 100 | 100 | 100 | 100 |
| Number | 64 | 92 | 199 | 163 |
Wages and salaries
Economic gender equality. Women and men must have the same opportunities and conditions for paid work that provide economic independence throughout life.
Economic equality is the second gender-equality policy sub-goal. Economic equality is influenced by several factors, such as labour-market conditions, education, tax and pension systems, and unpaid housework and care work. Statistics highlighting economic equality can also be found in the chapters on education, parental insurance, unpaid housework and care work, gainful employment and income.
This chapter takes a look at wages and salaries and the gender wage differentials. It is important to distinguish between wages or salary and income. Wages and salaries are defined as remuneration for work performed during a given unit of time, while income is a broader term that includes other types of income in addition to wages and salaries.
The Swedish National Mediation Office is tasked with monitoring the gender wage differentials. They state that the main reason for gender wage differentials is that women and men largely work in different occupations with different salary levels. The different size of the wage differential in different sectors is another contributing factor. It is highest in the regions and lowest in the municipalities. The average monthly wage across the entire labour market in 2023 was SEK 37,800 for women and SEK 42,000 for men.
Wage differentials
The gender wage differential is lowest in municipalities and highest in the regions. Since 1987, the gender wage differential has narrowed in all sectors. Across all sectors, women earned 90 percent of men's wages in 2023. Standard weighting can take into account that women and men have different ages, education, working hours, occupy different sectors and belong to different occupational groups. Any wage differential that remains after standard weighting cannot be explained by statistical methods. In 2023, women's share of men's wages after standard weighting was 95 percent.
Women’s pay as a percentage of men’s, by sector, 1994–2023
| Year | Municipality | County council |
Central government |
Private sector |
All sectors | |||||
| Unweighted | Weighted | Unweighted | Weighted | Unweighted | Weighted | Unweighted | Weighted | Unweighted | Weighted | |
| 1994 | 86 | . | 74 | . | 83 | . | 85 | . | 84 | . |
| 1996 | 87 | 98 | 71 | 94 | 83 | 93 | 85 | 91 | 83 | 92 |
| 1998 | 89 | 98 | 71 | 93 | 84 | 92 | 83 | 90 | 82 | 91 |
| 2000 | 90 | 98 | 71 | 93 | 84 | 92 | 84 | 90 | 82 | 92 |
| 2002 | 90 | 98 | 71 | 92 | 84 | 92 | 85 | 90 | 83 | 92 |
| 2004 | 91 | 98 | 71 | 93 | 85 | 92 | 85 | 91 | 84 | 92 |
| 2006 | 92 | 98 | 72 | 93 | 87 | 93 | 86 | 91 | 84 | 92 |
| 2008 | 92 | 99 | 73 | 93 | 88 | 93 | 86 | 91 | 84 | 92 |
| 2010 | 94 | 99 | 73 | 94 | 89 | 94 | 87 | 92 | 86 | 93 |
| 2012 | 94 | 99 | 75 | 94 | 91 | 94 | 88 | 92 | 86 | 93 |
| 2014 | 95 | 99 | 76 | 95 | 92 | 94 | 88 | 93 | 87 | 94 |
| 2015 | 95 | 99 | 78 | 95 | 93 | 95 | 88 | 93 | 87 | 94 |
| 2016 | 97 | 99 | 79 | 95 | 93 | 95 | 88 | 94 | 88 | 95 |
| 2017 | 97 | 99 | 79 | 95 | 93 | 95 | 89 | 94 | 89 | 95 |
| 2018 | 97 | 99 | 80 | 95 | 93 | 95 | 90 | 94 | 89 | 95 |
| 2019 | 98 | 99 | 81 | 96 | 94 | 95 | 91 | 94 | 90 | 95 |
| 2020 | 98 | 99 | 82 | 96 | 94 | 95 | 90 | 94 | 90 | 95 |
| 2021 | 98 | 99 | 82 | 96 | 95 | 95 | 90 | 94 | 90 | 95 |
| 2022 | 99 | 99 | 83 | 96 | 95 | 96 | 90 | 93 | 90 | 95 |
| 2023 | 99 | 99 | 82 | 96 | 94 | 95 | 91 | 93 | 90 | 95 |
Women’s pay as a percentage of men’ all sectors, 1994-2023
Between 2005 and 2023, the unweighted wage differential between men and women has narrowed by 6.4 percentage points. However, as of 2019, the gender wage gap has remained largely unchanged.
Development of the wage gap between women and men, 2005-2023
Wage distribution
Women's wage distribution in occupations requiring higher education is smaller than the distribution for men. This means that men's wages vary more within occupational areas. In all occupations requiring higher education, men's median is higher than women's. The median is the value that 50 percent of the group is below and 50 percent of the group is above. The highest distribution among both women and men in 2023 was in Managerial work in the private sector.
Wage dispersion in occupational groups that require higher education, 2023

The wage distribution for both women and men is smaller for occupations that do not normally require higher education and, in general, the differences between women and men are smaller than among occupations that do require higher education.
Wage dispersion by occupational groups that do not normally require higher education, 2023


Wages in different occupational groups
In the ten largest occupational groups in 2023, men had higher average earnings than women in seven out of ten groups. In the three occupations where women earned more than men, the difference was small, between SEK 200 and 400 per month. In the occupations where men earned more than women, the difference in average pay for one occupation was only SEK 100 a month, but in the other six occupations the difference was much greater, between SEK 1,100 and SEK 6,900.
Average salary in the ten most common occupational groups in 2023
| Occupational group | Number | Sex distribution | Sex distr. Average salary (SEK) |
Women's salaries as a % of men’s salaries |
|||
| Women | Men | Women | Men | Women | Men | ||
| Shop staff | 135 | 86 | 61 | 39 | 31 900 | 33 000 | 97 |
| Primary and preschool teachers |
156 | 38 | 81 | 19 | 36 900 | 37 000 | 100 |
| Attendants, care providers and personal care assistants, etc. |
134 | 57 | 70 | 30 | 30 900 | 30 700 | 101 |
| ICT architects, system developers and test managers |
44 | 131 | 25 | 75 | 50 500 | 53 900 | 94 |
| Office staff and secretaries |
139 | 28 | 83 | 17 | 34 700 | 36 400 | 95 |
| Assistant nurses | 144 | 21 | 87 | 13 | 32 100 | 31 700 | 102 |
| Organisation developers, analysts and HR specialists, etc. |
87 | 51 | 63 | 37 | 46 300 | 53 200 | 87 |
| Insurance advisors, sales and purchasing agents, etc |
50 | 85 | 37 | 63 | 43 700 | 50 200 | 87 |
| Childcare workers and student assistants, etc. |
103 | 20 | 84 | 16 | 26 900 | 26 700 | 101 |
| Engineers and technicians | 26 | 97 | 21 | 79 | 44 500 | 46 900 | 95 |
In the ten most common occupational groups, 45 percent of all employees are women and 26 percent of all employees are men.
Average salary in the ten most common occupational groups in 2023
Seven of the ten largest occupational groups are predominately female and three are predominately male. None of the occupational groups has an even sex distrubution.
Sex distribution The ten most common occupational groups in 2023
Income
Women and men must have the same opportunities and conditions for paid work that provide economic independence throughout life.
Economic equality is the second gender-equality policy sub-goal. Economic equality is influenced by several factors, such as labour-market conditions, education, tax and pension systems, and unpaid housework and care work. Statistics highlighting economic equality can also be found in the chapters on education, parental insurance, unpaid housework and care work, gainful employment and wages.
Income is a broader term than wages and salary and also includes other income. This chapter takes a look at income and how it is broken down between women and men.
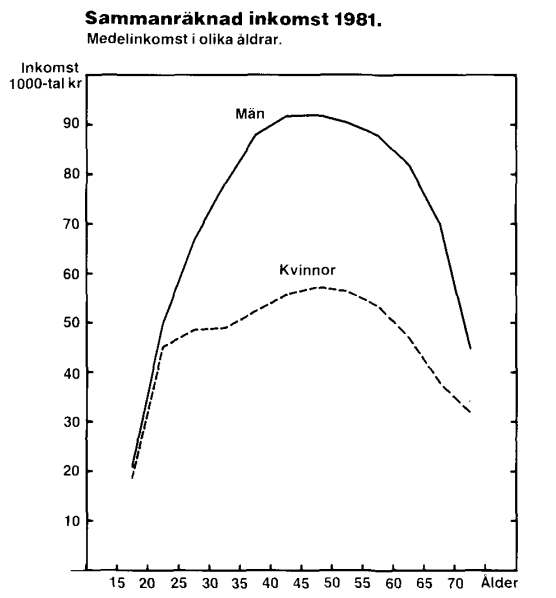
What is a wage and what is income in the statistics?
Wages and salary are distinct from income.
Wages and salary are compensation for work performed. In statistics on wages and salary, wages and salary are usually reported as 'monthly wages'. In this case, hourly and part-time wages have been converted to full-time wages for comparability. Thus, in the statistics, wages and salaries are not affected by, for example, absences, part-time work or overtime.
Income is defined more broadly than wages and salary. What is included depends on how income is defined, but in addition to income from labour, it can include, for example, pensions, social insurance benefits, means-tested benefits and capital income. Income statistics usually refer to annual income, which is affected by factors such as wage levels, absences from work, overtime, etc.
Earned income
Among single as well as cohabiting women and men, people in their fifties have the highest total earned income. Total earned income is lower among women and men in their twenties and among the elderly, especially among those aged 70 and over, whose income consists mostly of pensions.
Cohabiting men have the highest total earned income in all age groups, except among the very oldest. Among the very youngest women and those in their forties and fifties, cohabiting women have a higher total earned income than single women. Among women over 70 years of age, single persons have a higher total earned income than cohabitants.
Total earned income for cohabiting adults/single people, by age, 2022
Men have a higher total earned income compared to women in all age groups between 20 and 64, and this applies whether or not they have children living at home aged 0-19 years. The difference in total earned income is greater between women and men with children compared to women and men without children. This is the case in the age groups up to around 60, and thereafter women and men without children have a higher total earned income. However, the number of individuals with children aged 0-19 living at home is low in higher age groups, so that the differences in these groups are based on a smaller population and should be interpreted with some caution.
Another pattern that emerges is that women in their 30s without children have a higher total earned income than women with children in the same age group. In the age groups 40 years and older, the relationship is inverted. Men with children in the age groups 30 years and older have a higher total earned income compared to men without children.
Total earned income for persons with or without children aged 0-19, by age, 2022
Incomes have increased every year in the 2000s, with the exception of 2022, when incomes fell in real terms compared to previous years, due to inflation. Women's income measured as a share of men's income has also increased gradually throughout the 2000s. This applies to both earned and net income, and to the lower as well as the upper portions of the income scale. The same trend also applies to earlier periods, although statistics before 2000 are not fully comparable with later years' data.
Dispersion of total earned income among individuals aged 20–64 in 2000, 2010 and 2022

Dispersion of net income for individuals aged 20–64 in 2000, 2010 and 2022

Permanent low or high income means being in the same income group for six consecutive years. The income groups are created by dividing the population into five equal groups (quintiles), with the fifth and lowest income group in quintile 1 and the highest income group in quintile 5.
A greater share of women than men aged 20-64 have permanent low income. However, the difference between women and men has diminished over time. In 2005, the first year of measurement, there was an eight per cent difference between women and men who were permanently in the lowest income group. At the same time as gender gaps have narrowed, the share of permanent low income has increased for both women and men.
Persons aged 20-64 with persistently low/high income 2005-2022
To enable comparisons of disposable income between different types of households, an economic standard is used to relate the household’s total disposable income to the household composition of adults and children. In 2022, single women with children had the lowest economic standard. Economic standards were also lower in households with several children compared to households with one child. This was the case for cohabiting households as well as households with single men and single women.
Economic standard for individuals aged 20-64, by household type, 2022
| Type of household | Median income |
| Cohabiting | |
| without children | 421 |
| with children 0-19 years | 304 |
| of whom with one child | 335 |
| with two children | 305 |
| with three children or more | 245 |
| Single women | |
| without children | 266 |
| with children 0-19 years | 206 |
| of whom with one child | 223 |
| with two children or more | 192 |
| Single men | |
| without children | 285 |
| with children 0-19 years | 249 |
| of whom with one child | 264 |
| with two children or more | 234 |
In Sweden, slightly less than four per cent of households have received social assistance or introduction benefit. Single men without children are the most common household receiving social assistance and make up two-fifths of all households receiving social assistance. In terms of household type, however, the greatest proportion of households consisting of single women with children receive social assistance, at 11 per cent.
Households receiving financial assistance, by type of household, with applicants aged 18–64, 2023
| Type of household | Number | Proportion of everyone in each group |
Percentage distribution between household types |
| Cohabiting without children | 4 300 | 1 | 3 |
| Cohabiting with children | 13 400 | 1 | 10 |
| Single women without children | 37 400 | 5 | 27 |
| Single women with children | 21 100 | 11 | 15 |
| Single men without children | 57 700 | 6 | 42 |
| Single men with children | 3 700 | 6 | 3 |
| Total | 137 600 | 4 | 100 |
Pension and income for people aged 65 and over
The amount of pension you receive depends on several factors. Simply put, the higher your salary and the more you work, the higher your pension.
Women are on average paid less than men. This wage differential is largely due to the fact that women and men work with different things and in different sectors. Women also work part-time to a greater degree than men, take the majority of parental leave and childcare days and have more sick days. All this leads to women having less income than men, resulting in a lower pension at the end of their working life.
In 2022, women's share of men's pensions was 75 percent and the difference increases with age. In the oldest age group, 85-89 years, women's pensions were 67 percent of men's and in the youngest age group, 65-69, they were 77 percent.
Women’s pensions as a percentage of men’s pensions (average value), by age, 2004–2022
People aged 65 and older, by type of pension, 2022
| Type of pension | Number of people with a pension |
Pension, median value |
Proportion with type of pension |
Women’s pension as a % of men’s pension (median value) |
|||
| Women | Men | Women | Men | Women | Men | ||
| Total with some kind of pension |
1 123 | 985 | 197 | 261 | 98 | 98 | 75 |
| Of whom with | |||||||
| National pension | 1 111 | 970 | 160 | 200 | 97 | 97 | 80 |
| Of whom with minimum pension |
700 | 228 | 10 | 8 | 61 | 23 | 133 |
| Occupational pension |
995 | 886 | 32 | 56 | 87 | 88 | 57 |
| Private pension | 298 | 279 | 24 | 31 | 26 | 28 | 80 |
Among those aged 65 and over, single women have higher net incomes than cohabiting women. For men, on the contrary, the net income of single people is lower than that of cohabiting people.
Among those aged 65 and over, cohabiting women have a smaller share of men's net income than women living alone. In 2022, single women's share was 90 percent of men's net income, while cohabiting women's share was 73 percent.
Net income for people aged 65 and older, by type of household and age, 2022
| Single | |||||
| Age | Women | Men | Women’s share of men’s net income |
Number | |
| Women | Men | ||||
| 65‑69 | 244 | 261 | 93 | 86 | 71 |
| 70‑74 | 199 | 213 | 93 | 95 | 66 |
| 75‑79 | 192 | 209 | 92 | 110 | 64 |
| 80‑84 | 189 | 209 | 90 | 92 | 42 |
| 85- år | 186 | 208 | 89 | 131 | 43 |
| Total | 194 | 216 | 90 | 514 | 286 |
| Cohabiting | |||||
| 65‑69 | 239 | 340 | 70 | 157 | 165 |
| 70‑74 | 185 | 256 | 72 | 151 | 164 |
| 75‑79 | 165 | 225 | 73 | 131 | 155 |
| 80‑84 | 157 | 216 | 73 | 63 | 88 |
| 85- år | 149 | 208 | 72 | 28 | 51 |
| Totalt | 183 | 249 | 73 | 530 | 624 |
Income from capital and capital gains
Capital income and capital gains are a type of income that has increased in recent years, contributing to a widening income gap between women and men.
Capital income and capital gains are very unevenly distributed. The ten per cent of the population with the greatest income from capital had 97 per cent of the total in 2022. Capital income is also unevenly distributed between the sexes. In all age groups, except children, men have more income from capital than women. In 2022, slightly less than a third of this income went to women while slightly over two-thirds went to men.
Capital income and capital gains 2022
| Sum | Sex distribution | ||
| Women | Men | ||
| Interest and dividend | 210 264 | 20 | 80 |
| Standardised income | 23 066 | 37 | 63 |
| Renting out a private home | 6 007 | 38 | 62 |
| Reallocation of earned income to capital gains as standardised interest (selfemployed) |
7 765 | 25 | 75 |
| Capital gain (gross) | 233 823 | 40 | 60 |
| Capital loss (gross | 10 828 | 29 | 71 |
| Total capital income and capital gain | 470 097 | 31 | 69 |
Capital income and capital gains by age in 5-year classes, 2022
Crime

Men’s violence against women must stop. Women and men, girls and boys must have the same rights and opportunities to physical integrity.
The sixth gender-equality policy sub-goal is to end men's violence against women. Women and men, girls and boys, must have the same right and opportunity to bodily integrity.
Men's violence against women reflects a power imbalance between the sexes and is a gender-equality issue. In this chapter you will find gender statistics on fear of and concern about violent crime. You will also find gender statistics on exposure to threats, assaults and sexual offences, as well as reported offences and persons prosecuted for crimes.
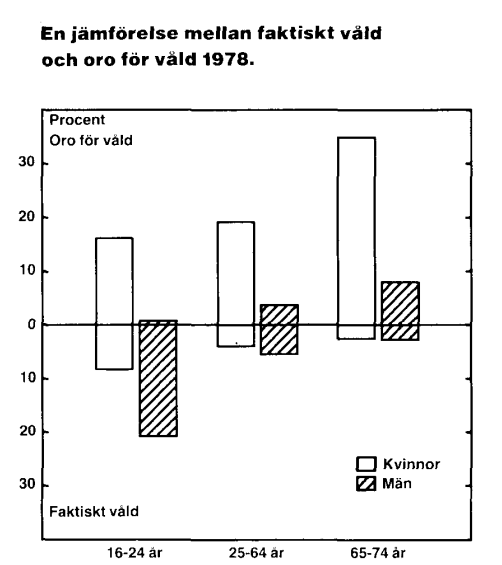
Development and monitoring over the last 40 years
For a long time, men's violence against women was seen as a private issue rather than a political one. In 1984, the law was amended to make rape a criminal offence. However, it was not until the 1990s that men's violence against women became more prominent in national gender-equality policy. In 1993, the United Nations adopted the Declaration on the Elimination of Violence against Women. In the same year, an inquiry was set up in Sweden. Following this, national legislation was amended at the end of the decade. These amendments included the introduction of the offence of gross violation of a woman’s integrity. Shortly afterwards, the law prohibiting the purchase of sexual services was introduced. In the mid-1990s, a national centre was also established, which eventually, in the 2000s, evolved into the National Centre for Knowledge on Men's Violence against Women.
In the 2000s, national efforts have included an action plan and a national strategy to prevent and combat men's violence against women. This has been accompanied by amended legislation. For example, sexual-offences legislation has been amended on several occasions, including the consent-based rape law introduced in 2018. In the section Progress so far you can read more about all this.
In terms of statistics, the Statistics on Income and Living Conditions have included questions about exposure to violence and perceived safety since the early 1980s, i.e. for about 40 years. For about half that time, i.e. almost 20 years, the Swedish National Council for Crime Prevention has conducted the annual Swedish Crime Survey, which contains more detailed statistics on exposure to crime and perceived safety. Both surveys have undergone changes over the years, and the statistics are therefore not fully comparable over time.
Fear of and concern about crime
The Swedish National Council for Crime Prevention conducts the Swedish Crime Survey annually. The purpose of the Survey is, among other things, to investigate people's exposure to crime as well as their fears of and concerns about crime.
Concerns about being assaulted and concerns about rape or sexual assault
Among younger people, a slightly higher proportion of women than men are concerned about being assaulted. When it comes to concerns about rape or other forms of sexual assault, the gender differences are much greater. Among younger women, almost four in ten report such concerns, and the proportion is consistently higher among women than men in all age groups. The proportion of men who are concerned about being raped or sexually assaulted is consistently low.
People who fear assault, by age, 2024
| Women | Men | |
|---|---|---|
| 16-24 years | 13 | 10 |
| 25-44 years | 10 | 11 |
| 45-64 years | 7 | 8 |
| 65-84 years | 5 | 5 |
People who fear rape/other sexual assault, by age, 2024
| Women | Men | |
|---|---|---|
| 16-24 years | 37 | 2 |
| 25-44 years | 22 | 2 |
| 45-64 years | 10 | 1 |
| 65-84 years | 3 | 0 |
Forty percent of women aged 16-24, and around one third of women aged 25 and over, feel unsafe going out late at night in their neighbourhood. This proportion is significantly higher than the corresponding proportion among men. The largest proportion of women who feel unsafe is found among the youngest and oldest age groups. A greater proportion of women than men also report that they have refrained from an activity due to concerns about crime.
People who feel unsafe when outdoors at night in their own neighbourhood by age, 2024
| Women | Men | |
|---|---|---|
| 16-24 years | 39 | 15 |
| 25-44 years | 30 | 18 |
| 45-64 years | 27 | 17 |
| 65-84 years | 33 | 17 |
People who have refrained from any activity out of fear of being subjected to crime, 2024
| Women | Men | |
|---|---|---|
| 16-24 years | 13 | 7 |
| 25-44 years | 14 | 9 |
| 45-64 years | 14 | 9 |
| 65-84 years | 12 | 6 |
Fear of and concern about crime in different types of neighbourhoods
The Swedish Crime Survey presents results based on three different area types. This is done in order to compare concerns about crime between neighbourhoods with different socio-economic conditions. The results are disseminated for socio-economically disadvantaged areas, socio-economically mixed areas and socio-economically advantaged areas.
A greater proportion of women and men in socio-economically disadvantaged areas are concerned about being victims of assault compared to socio-economically mixed or advantaged areas. Women are also slightly more likely to be concerned about being assaulted in socio-economically mixed areas compared to socio-economically advantaged areas. This difference is not seen for men.
Among women, the proportion who report that they fear rape or sexual assault is almost the same regardless of area type, with 15-17 percent of women reporting such fears. For men, the rates are low regardless of area type, with between 1-2 percent of men reporting fear of rape or sexual assault.
In socio-economically disadvantaged areas, a large proportion of people, almost half of women and a third of men, feel unsafe outdoors at night in their neighbourhood. In comparison, the proportion of women and men who feel unsafe outdoors is about ten percentage points lower in socio-economically mixed areas and another ten percentage points lower in areas with socio-economically advantaged areas.
One consequence of fears related to crime may be to refrain from activities. Among women in socio-economically disadvantaged areas, almost two out of ten women report abstaining from an activity due to fear of crime. In socio-economically mixed areas, the proportion is slightly less and even slightly less in socio-economically advantaged areas. The proportion of men who have abstained from an activity is lower than that of women, with one in ten men in socio-economically disadvantaged areas and 8 percent in other areas.
Source: Swedish Crime Survey, Swedish National Council for Crime Prevention.
People with disabilities who have refrained from going out for fear of being attacked
In the surveys of living conditions conducted by Statistics Sweden, the proportion of women and men who report that they have refrained from going out for fear of being attacked or otherwise threatened is higher among people with disabilities than among others. Among women and men with disabilities, the proportion was 34 and 16 percent respectively, compared to 24 and 8 percent among women and men without disabilities, in 2023.
Source: Statistics on Income and Living Conditions (SILC), published in Women and men in Sweden - Facts and figures 2024, Statistics Sweden
Note: In 2022, the collection method of the SILC was changed, which affected the reporting group persons with disabilities. The statistics are therefore not comparable with previously disseminated data.
![]()
Self-reported exposure to crime
Threats, assault and sexual offences
One in five women aged 16-24 reported being a victim of sexual offences in 2023. After that, the proportion decreases with the increasing age of the age group. Two percent of men aged 16-24 years report having been a victim of sexual offences in 2023, with lower rates in older age groups.
Self-reported subjection to threats, assault and sexual crimes by age, 2023
Exposure to sexual offences ranges from minor offences, such as offensive sexual comments, to very serious crimes, such as rape. Among women, 1.2 percent reported being subjected to coercive sexual acts in 2023 and 1.1 percent reported being subjected to a sexual offence involving the exploitation of a defenceless position. Among men, 0.2 percent reported being subjected to coercive sexual acts in 2023 and 0.2 percent reported being subjected to a sexual offence involving the exploitation of a defenceless position.
Source: Swedish Crime Survey, Swedish National Council for Crime Prevention.
Type of crime scene and sex of offender
In order to gain in-depth knowledge of the circumstances surrounding exposure to various crimes, the Swedish National Council for Crime Prevention also conducts follow-up interviews with a sample of people who stated in the Swedish Crime Survey that they have been victims of crime.
In incidents of assault against women, the most common crime scene was the home, and the second most common was at work or school. In incidents of assault against men, the most common crime scene was a public space, again followed by work/school.
Type of crime scene in occurrences of assault, 2022
| Women | Men | |
|---|---|---|
| Public place | 14 | 51 |
| Work/school | 34 | 31 |
| Home | 46 | 14 |
| Other place | 6 | 5 |
| Total | 100 | 100 |
Relationship to the offender in incidents of assault
In incidents of assault against women, the single most common relationship to the perpetrator was that of a friend or acquaintance (42 percent) and a partner or former partner (30 percent). In incidents of assault against men, the most common offender was a complete stranger (48 percent).
Source: Swedish Crime Survey - follow-up interviews 2023, Swedish National Council for Crime Prevention.
In 80 percent of incidents of assault against women, the perpetrator was reported to be male, and in incidents of assault against men, the perpetrator was male in 91 percent of cases.
Sex of the perpetrator in occurrences of assault, 2019
| Sex of the perpetrator | Sex of the victim | |
| Female | Male | |
| Female | 20 | 9 |
| Male | 80 | 91 |
| Total | 100 | 100 |
Violence in close relationships
Violence in close relationships affects women as well as men, but the incidence is higher among women. A report by the Swedish National Council for Crime Prevention shows that this is true, both for victimisation in 2022 and throughout life. In 2022, 15 percent of women and 12 percent of men aged 16-84 were victims of violence in close relationships.
According to the report, psychological violence is the most prevalent form of violence among both women and men (13 percent for women and 11 percent for men), but women are significantly more likely than men to report being subjected to sexual violence by a current or former partner. The proportion who reported being a victim of sexual violence during 2022 was 4 percent of women and 1 percent of men.
The share of victimised women who state that they have filed at least one police report related to the incident(s) is greater than that of men (4 percent and 1 percent respectively). The main reason, among both female and male victims, for not making a police report, is feeling that what occurred was not serious enough to report it to the police.
Source: Swedish National Council for Crime Prevention (2024), Intimate partner violence - Mapping victimisation during 2022 and throughout life, Report 2024:4, Stockholm: Swedish National Council for Crime Prevention.
Offences reported and prosecuted
The Swedish National Council for Crime Prevention disseminates statistics on reported crimes, which include all incidents reported and registered as crimes by the Swedish Police Authority, the Swedish Prosecution Authority, the Swedish Customs and the Swedish Economic Crime Authority. However, statistics on reported crime are not suitable for studying the level of victimisation, because many crimes are never reported to the criminal justice system.
Of the offences against individuals reported in the 2023 Swedish Crime Survey, follow-up interviews indicated that most incidents were not reported to the police. However, the propensity to report differed for different offences. For both threats and assaults against women, around 20 percent of incidents were reported to the police. The corresponding proportion for men is about the same for incidents of threats, but slightly lower for incidents of assault (15 percent). However, the estimates are subject to uncertainty, and the difference between women and men is within the statistical margin of error. For incidents where women were victims of sexual offences, 7 percent of incidents were reported to the police.
Source: Swedish Crime Survey - follow-up interviews 2023, Swedish National Council for Crime Prevention.
Reported assault
The number of reported cases of assault, against both women and men, increased in the 1990s and early 2000s. This increase may be due, among other things, to a greater propensity to report violent offences, i.e., that the dark figure decreased. The 'dark figure', which is the ratio between actual crime and reported crime, decreases if a larger proportion of the crimes committed are reported. In the 2010s, the number of reported cases of assault against men where the perpetrator was unknown fell sharply. At the same time, the number of reported cases of assault against women where the perpetrator was known has continued to increase.
Reported assaults against women 1990-2023
Reported assaults against men, 1990-2023
The majority of assaults against women, more than 80 percent in 2023, are crimes where the perpetrator was known. For assaults against men, the majority, 57 percent, were unknown. The number of reported offences of assault against men where the perpetrator was unknown continued to decrease in the early 2020s. During the years of pandemic restrictions, the number of police reports dropped further. Although the number subsequently increased in 2022 and 2023, it is at about the same level as in 2019.
The same trend applies to assaults against women where the perpetrator was unknown, although this type of offence is generally higher for men. For assaults against women where the perpetrator was known, the increase continued in 2020 and 2021. In 2022, the number of reported offences of assault against women where the perpetrator was known decreased, but in 2023, reports increased and the number of reported offences was six percent higher compared to 2022.
Assaults against men where the perpetrator was known decreased in 2021 and 2022 after a slight increase in 2020; assaults against men by acquaintances also increased in 2023 compared to 2022 by four percent. Overall, the number of reported offences of assault against women was slightly higher in 2023 compared to 2022. For men, the number was also at a higher level, but the difference was smaller.
Reported assault crimes on people aged 18 years and older by relationship with perpetrator and place, 2023
Unlawful violation of integrity
Since 2017, anyone who violates the privacy of another person by disseminating sensitive images or information with the intention of causing serious harm can be convicted of unlawful violation of integrity.
In 2023, 668 cases of unlawful violation of integrity were reported against girls and 356 against boys under 18 years of age, and 682 cases against women and 448 against men aged 18 or over.
Source: Swedish National Council for Crime Prevention.
Reported unlawful threats against people 18 years and older, by whether or not the offence was internet-related, 2023
| Women | Men | |
|---|---|---|
| Not internet-related | 16 590 | 17 060 |
| Internet-related | 3 170 | 2 800 |
Lethal violence
Since the mid-2010s, the number of victims of lethal violence has been at an increased level, compared to the period 2002-2014. However, different types of lethal violence have evolved differently, and the increase is due to lethal violence in criminal milieux. An analysis by the Swedish National Council for Crime Prevention shows that the increased trend mainly concerns younger men. This has led to a change in the gender distribution of victims of lethal violence. In the early 2010s, about one third of victims of lethal violence were women and two thirds were men. In recent years, about one quarter have been women and three quarters men.
In 2023, 27 percent of victims of lethal violence were women and 73 percent were men. The majority of lethal violence in 2023 involved people aged 18 or over, both women and men.
There is a clearly gendered pattern when it comes to the offender's relationship to the deceased. For six out of ten female victims of lethal violence, the offender was a current or former partner, while the corresponding proportion was very low among male victims.
Source: Swedish National Council for Crime Prevention. Lethal violence in Sweden 1990–2014 Trends and characteristics, Report 2024:6, Stockholm: Swedish National Council for Crime Prevention.
Swedish National Council for Crime Prevention. Konstaterade fall av dödligt våld - En granskning av anmält dödligt våld 2023. Stockholm: Swedish National Council for Crime Prevention.
People convicted of crimes
People convicted of crimes under the Penal Code, the Road Trafc Offences Act and the Penal Law on Narcotics, 2023
| Main crime | Number | Sex distribution | |||
| Women | Men | Women | Men | ||
| Crimes against individuals | 1540 | 9570 | 14 | 86 | |
| Crimes against life and health | 950 | 4770 | 17 | 83 | |
| of which assault | 790 | 4120 | 16 | 84 | |
| Crimes against freedom and peace | 520 | 2960 | 15 | 85 | |
| of which gross violation of integrity |
10 | 70 | 13 | 88 | |
| gross violation of a woman’s integrity |
. | 140 | . | . | |
| unlawful threats | 180 | 1010 | 15 | 85 | |
| Sexual crimes | 30 | 1800 | 15 | 85 | |
| of which rape | .. | 350 | .. | .. | |
| rape of children | .. | 160 | .. | .. | |
| Offences against property | 7250 | 15150 | 32 | 68 | |
| Offences against the public | 350 | 1290 | 21 | 79 | |
| Offences against the state | 680 | 2810 | 19 | 81 | |
| All offences against the Penal Code |
9820 | 28830 | 25 | 75 | |
| Offences under the Road Trafc Offences Act |
3140 | 19200 | 14 | 86 | |
| Offences under the Penal Law on Narcotics |
4560 | 26800 | 15 | 85 | |
Power and influence
Women and men must have the same rights and opportunities to be active citizens and to shape the conditions for decision-making in all sectors of society.
Equal distribution of power and influence is the first gender-equality policy sub-goal. This chapter on power and influence considers gender equality in our democracy, from who votes to who is elected. This chapter also considers the conditions under which our elected representatives hold office and whether these differ for women and men.
Sweden is a representative democracy. This means that popularly elected assemblies, such as the Riksdag, should represent the people. Some say it is enough that we have the opportunity to vote for parties and candidates that represent our views or ideology. Others argue that people have different experiences that can be linked to whether they are young women or middle-aged men, for example, and that this also influences the decisions they make. There are also arguments that it is fairer if different groups in the population are also represented among our elected politicians.
To examine how well politicians reflect the populace, members of parliament are often compared with persons entitled to vote. This is called representativeness.
Power and influence also concerns those occupying positions of influence beyond politics, such as in companies and workplaces. Therefore, this chapter also addresses the gender breakdown in the business sector and among managers and employees.
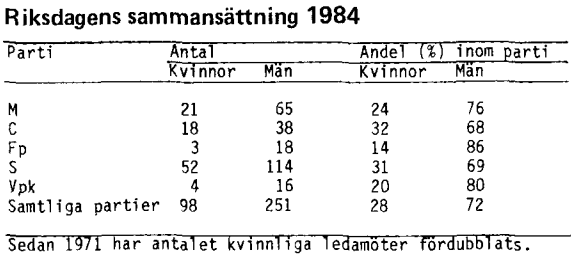
Voter turnout
Persons entitled to vote in Riksdag elections are
- 18 years old no later than election day,
- Swedish citizens and
- currently or previously registered as a resident of Sweden.
Source: Swedish Election Authority
Historically, voter turnout has been equal between women and men. Women as a group are slightly more likely to vote than men, but the difference is small.
Voter turnout in general elections 1973–2022
| Year | All women | All men | First-time voters women | First-time voters men |
|---|---|---|---|---|
| 1973 | 92 | 92 | 84 | 87 |
| 1976 | 94 | 94 | 90 | 89 |
| 1979 | 94 | 93 | 89 | 86 |
| 1982 | 93 | 92 | 91 | 86 |
| 1985 | 93 | 92 | 89 | 88 |
| 1988 | 87 | 84 | 77 | 74 |
| 1991 | 88 | 86 | 81 | 80 |
| 1994 | 88 | 86 | 85 | 78 |
| 1998 | 83 | 82 | 73 | 75 |
| 2002 | 80 | 80 | 72 | 69 |
| 2006 | 83 | 82 | 78 | 74 |
| 2010 | 85 | 84 | 82 | 79 |
| 2014 | 86 | 85 | 84 | 81 |
| 2018 | 88 | 87 | 89 | 84 |
| 2022 | 85 | 84 | 86 | 81 |
In the 2022 Riksdag elections, 85 percent of women and 84 percent of men voted. However, turnout varies with age: it is highest among the youngest, drops until the age of 25 and then increases again. Among elderly people, voter turnout drops rapidly after the age of 80. There are clear gender differences among both younger and elderly people. More women than men vote up to the age of 45, while more men than women vote after the age of 75.
Voter turn out i general elections, 2022, by age
Riksdag
In the 1921 Riksdag elections, Swedish women were allowed to vote and could also stand for election for the first time. Nevertheless, few women were elected to the Riksdag in the early decades. In the 1921 elections, five women were elected, representing slightly more than one percent of the seats. In the next election, the proportion of women fell to just under one percent, but then increased in every election until 1991. At that time, the proportion of women in the Riksdag fell by almost five percentage points, to 33 percent.
The break in the trend in 1991 led to an intensified debate on representation in the Swedish parliament. In the next election, in 1994, several parties therefore introduced candidate lists that were evenly divided between men and women. Alternating the candidates on the ballot papers in this way is known as ‘the zipper system'.
It was not until after the 1994 Riksdag that gender balance was achieved in the Riksdag, with at least 40 percent women and at least 40 percent men. Over the last 25 years, the share of women has been around 45 percent and the share of men around 55 percent. Sweden's parliament has never had more women than men.
Composition of the Riksdag 1919–2022
The gender breakdown of those elected to the Riksdag varies between parties. The Left Party has the highest proportion of women MPs, with 71 percent women and 29 percent men. The Sweden Democrats have the highest proportion of male MPs, with 74 percent men and 26 percent women. The Green Party and the Christian Democrats also have an uneven gender breakdown among their members, while the Liberals, the Centre Party, the Social Democrats and the Moderate Party are in the 40/60 range and have an even gender distribution among their members of parliament.
Elected to the Riksdag by party, September 2022
| Party | Number | Sex distribution | ||
| Women | Men | Women | Men | |
| Centre Party | 13 | 11 | 54 | 46 |
| Christian Democrats | 6 | 13 | 32 | 68 |
| Liberals | 9 | 7 | 56 | 44 |
| Green Party | 12 | 6 | 67 | 33 |
| Moderate Party | 32 | 36 | 47 | 53 |
| Social Democrats | 53 | 54 | 50 | 50 |
| Sweden Democrats | 19 | 54 | 26 | 74 |
| Left Party | 17 | 7 | 71 | 29 |
| Total | 161 | 188 | 46 | 54 |
Elected to the Riksdag by party, September 2022
For Riksdag elections, candidates are nominated by their respective parties, then voters can vote on the candidates. Fewer women than men are nominated to the Riksdag, but the gender distribution is still even, with 44 percent women and 56 percent men. Among elected candidates, 46 percent are women and 54 percent are men.
Nominated and elected candidates to the Riksdag, by born in Sweden/abroad, 2022
| Country of birth | Nominated | Elected | ||||||
| Number | Sex distribution | Number | Sex distribution | |||||
| Women | Men | Women | Men | Women | Men | Women | Men | |
| Born in Sweden | 2387 | 3041 | 44 | 56 | 152 | 169 | 47 | 53 |
| Born abroad | 331 | 398 | 45 | 55 | 9 | 19 | 32 | 68 |
| Total | 2718 | 3439 | 44 | 56 | 161 | 188 | 46 | 54 |
Among those born abroad, 45 percent of nominees to the Riksdag are women and 55 percent are men. After Riksdag elections, the gender distribution becomes uneven, with only 32 percent of elected, foreign-born persons being women and 68 percent men.
Nominated and elected candidates to the Riksdag, by born in Sweden/abroad, 2022
In the Riksdag, the gender distribution among committee chairs has been even for a long time but is now uneven, with 20 percent women and 80 percent men. Before the 2022 Riksdag elections, about half of the chairs were women and half were men. After the 2022 elections, one third of the chairs were women and two thirds were men. Since then, the proportion of women has fallen further.
Chairs of the Parliamentary committees, 2012-2024
Government and Government Offices
The gender breakdown in different positions in the Government Offices varies. Among ministers, 43 percent are women and 57 percent are men. For secretaries of the state, the gender distribution is uneven, with 38 percent women and 62 percent men.
The biggest change over time is seen among managerial staff, where in 2024 there are 55 percent women and 45 percent men, compared to a level of 11 percent women and 89 percent men 40 years ago.
Top officials at the Government Offices, by position in 1985, 2000 and 2024
| Position | 1985 | 2000 | 2024 | |||
| Women | Men | Women | Men | Women | Men | |
| Ministers | 25 | 75 | 55 | 45 | 43 | 57 |
| State secretaries | 12 | 88 | 38 | 62 | 38 | 62 |
| High-level ofcials | 11 | 89 | 27 | 73 | 55 | 45 |
Ministers including the Prime Minister
State-owned enterprises
Over a twenty-year period, state-owned enterprises have gone from having an unequal gender breakdown to achieving even gender distribution in all positions by 2023. The portfolio of state-owned enterprises includes 44 wholly and partly owned companies.
Boards and management of wholly or partially state-owned enterprises, 2002 and 2023
| 2002 | 2023 | |||
| Women | Men | Women | Men | |
| Chair | 13 | 87 | 45 | 55 |
| Managing Director | 12 | 88 | 53 | 47 |
| Board members | 37 | 63 | 51 | 49 |
Municipality and region
Women could be elected to municipal and town councils as of 1909, but it was not until ten years later that they could vote in municipal and county council elections on the same terms as men.
During the 20th century, Sweden went from all-male municipal councils to a gender balance in 1994, with at least 40 percent women and at least 40 percent men. For the last thirty years, the proportion of women on municipal councils has been just over 40 percent and the proportion of men just under 60 percent. It is questionable whether the gender breakdown is even, when it stays at a level close to 40/60 for so long without approaching 50/50.
Elected to municipal councils 1919–2022
The gender breakdown in different municipal councils is not always equal, and the differences have increased over time. In 2014, one fifth of Sweden's municipalities had an unequal gender breakdown, which increased to more than a quarter after the 2022 elections.
Sex distribution in municipal councils 2014, 2018 and 2022
| 2014 | 2018 | 2022 | |
| 60-100 % w, 0-40 % m | - | - | 1 |
| 55-60 % w, 40-45 % m | 3 | 6 | 1 |
| 45-55 % w, 45-55 % m | 113 | 104 | 108 |
| 40-45 % w, 55-60 % m | 111 | 104 | 100 |
| 0-40 % w, 60-100 % m | 63 | 76 | 80 |
Overall, fewer women than men are nominated for municipal and regional elections, among both native- and foreign-born persons.
Among elected members of regional councils, foreign-born women outnumber foreign-born men, with a gender breakdown of 55 percent women and 45 percent men. In other cases, women outnumber men in both municipalities and regions.
Nominated and elected candidates in Municipal council and Regional council elections, by born in Sweden/abroad, 2022
| Regional council | ||||||||
| Number | Sex distribution | Number | Sex distribution | |||||
| Women | Men | Women | Men | Women | Men | Women | Men | |
| Born in Sweden | 4781 | 6317 | 43 | 57 | 752 | 803 | 48 | 52 |
| Born abroad | 708 | 787 | 47 | 53 | 93 | 72 | 56 | 44 |
| Total | 5 489 | 7 104 | 44 | 56 | 845 | 875 | 49 | 51 |
| Municipal council | ||||||||
| Born in Sweden | 19539 | 27113 | 42 | 58 | 4977 | 6578 | 43 | 57 |
| Born abroad | 2448 | 2913 | 46 | 54 | 481 | 561 | 46 | 54 |
| Total | 21987 | 30026 | 42 | 58 | 5 458 | 7 139 | 43 | 57 |
The political work of a municipality or region is led by a municipal or regional council chair. The 2022 elections resulted in approximately one third of Sweden's 290 municipalities having a woman as chair of the municipal council, while two thirds of municipalities had a man. To date, there has never been gender balance in this post.
In regional councils, chairmanship has been balanced in terms of gender since the 2010 elections.
Chairs of municipal councils 2007, 2011, 2015 and 2023
Chairs of regional councils, 2007, 2011, 2015 and 2023
| Year | 2007 | 2011 | 2015 | 2023 | ||||
| Women | Men | Women | Men | Women | Men | Women | Men | |
| Regional executive board |
35 | 65 | 45 | 55 | 45 | 55 | 50 | 50 |
Overall in Sweden's municipalities, 44 percent of elected politicians on specialist committees are women and 56 percent are men. The gender breakdown varies depending on the type of committee. The area with the most unequal gender distribution is technical, environmental and transport committees, where 30 percent are women and 70 percent are men.
Representative positions in municipality councils, by committee, 2023
In the regions, the overall gender breakdown in the specialist committees is very even, with half women and half men. In the regional councils, the gender breakdown also varies by type of committee, but the differences are smaller.
Representative positions in regional councils, by committee, 2023
Leaving office
During the 2018-2022 term of office, 22 percent of women and 20 percent of men left their municipal council positions early. This is a decrease for women compared to 2014-2018. The number of men leaving office remained unchanged.
The number of persons leaving office is unevenly distributed between different groups. It is mainly young women who leave office early. In 2018-2022, 41 percent of women aged 18-29 left office, compared to 36 percent of men in the same age group.
Elected representatives who left the municipal council before the end of the term of office, by age and term of office
| Age | Sex | Term of office | ||||
| 2002 ‑2006 | 2006 ‑2010 | 2010 ‑2014 | 2014 ‑2018 | 2018 ‑2022 | ||
| 18-29 years | Women | 41 | 41 | 46 | 45 | 41 |
| Men | 36 | 36 | 42 | 40 | 36 | |
| 30-49 years | Women | 22 | 23 | 27 | 29 | 27 |
| Men | 17 | 19 | 19 | 23 | 22 | |
| 50-64 years | Women | 14 | 12 | 15 | 18 | 18 |
| Men | 11 | 12 | 14 | 17 | 17 | |
| 65+ years | Women | 12 | 12 | 13 | 14 | 17 |
| Men | 16 | 15 | 16 | 16 | 18 | |
| Tota | Women | 19 | 18 | 22 | 24 | 22 |
| Men | 15 | 16 | 18 | 21 | 20 | |
Politicians’ safety
The Swedish National Council for Crime Prevention conducts a biennial survey on the safety of politicians. Members of the Riksdag, regional councils and municipal councils are asked whether they have been subjected to harassment, threats or violence and what the consequences have been.
The results show that almost one in three elected women report having been subjected to threats, violence or harassment because they hold political office. Among men, the proportion is slightly lower. Younger politicians, both women and men, are more likely to report being victimised.
Women are more often victimised than men in all age groups, except in the 40-49 age group, where more men are more often victimised, and in the oldest age group, where the proportion is almost equal. The greatest difference is in the 30-39 age group, where more than 40 percent of women and around 30 percent of men have been victimised.
Threats, violence and harassment against elected officials in 2022
The political body to which the elected representative belongs also has an effect on victimisation. Among Riksdag politicians, two out of three have experienced harassment, threats or violence. Women are victimised to a slightly greater degree than men, but the difference is small.
Threats, violence and harassment against elected officials in 2022 by political assembly
The results also show how elected representatives are affected by harassment, threats and violence. More than half of the victimised women report that the events have had some kind of impact on their job. Just under 40 percent of the victimised men report that it has had consequences for their job.
The most common consequence among those who were victimised in 2022 is that elected representatives limit their social media activity. Almost 60 percent of women and almost half of men state this. It is also common for them to avoid engaging or speaking out on specific policy issues.
Consequences of victimisation among elected officials
Sweden within the European Union
After the 2024 European Parliament elections, the gender breakdown among candidates remains uneven. Of the 720 members, 39 percent are women and 61 percent are men. The share of women has decreased slightly, compared to the 2019 elections.
The Composition of the European Parliament 1999-2024
In the Swedish elections to the European Parliament in 2024, 21 Swedish politicians were elected. Of these, 62 percent were women and 38 percent were men. This means that Sweden has a higher proportion of women among its elected candidates compared to the average in the European Parliament.
Elected Candidates in Swedish Elections to the European Parliament, 1999-2024
Business sector
One area that has long been among the least gender balanced is the boards of listed companies. Board make-up has long been approaching 40/60, with 36 percent women and 64 percent men in 2023.
In 2023, 10 percent of board chairs were women and 90 percent were men. Fourteen percent of listed companies have a woman as CEO, 86 percent have a man.
The gender breakdown among board members of limited companies has also become more even, with 35 percent women and 65 percent men as of 2023. It is noteworthy that more than half of the women who were board members of limited companies are deputy members, while one third were directors. Among men, just over half were directors and just under a quarter were deputy members. This means that, although the overall distribution has approached gender parity, men are more likely to have voting rights at board meetings than women, as the voting rights of deputies depend on the absence of a non-deputy member of the board of directors.
Boards and management of listed companies 2023
Overall, the gender breakdown at management level can be considered even, with 42 percent women and 58 percent men. However, women and men often hold managerial positions in different sectors. In the regions, the managerial ranks were predominately female in 2023, with 75 percent women in managerial positions and 25 percent men. The most even gender breakdown was in the central government sector, where 52 percent of managers were women and 48 percent men.
Board members, by function in limited companies, 2021
| Function | Percentage distribution | Sex distribution | ||
| Women | Men | Women | Men | |
| Chair | 5 | 13 | 18 | 82 |
| Board members | 34 | 54 | 25 | 75 |
| Deputy members | 52 | 24 | 54 | 46 |
| Other | 9 | 9 | 35 | 65 |
| Total percen | 100 | 100 | 35 | 65 |
| number | 266 500 | 499 200 | ||
Managers
In 2023, neither the private nor the public sector had a gender balance in managerial positions. In the private sector, 35 percent of managers were women and 65 percent were men. In the public sector, 71 percent of managers were women and 29 percent were men.
Managers, by sector, 2023
A clear pattern emerges in which the share of women among managers, in both the private and public sectors, was lower than the share of women among employees. The opposite was true for men, who were over-represented in managerial positions compared to the proportion of male employees.
In the public sector, the share of women among managers was relatively high, but still lower than the share of women among employees. This indicates that, even in sectors where the majority of employees are women, women did not attain managerial positions as often as men.
Managers and all employees in the private and public sectors, 2023
Progress so far
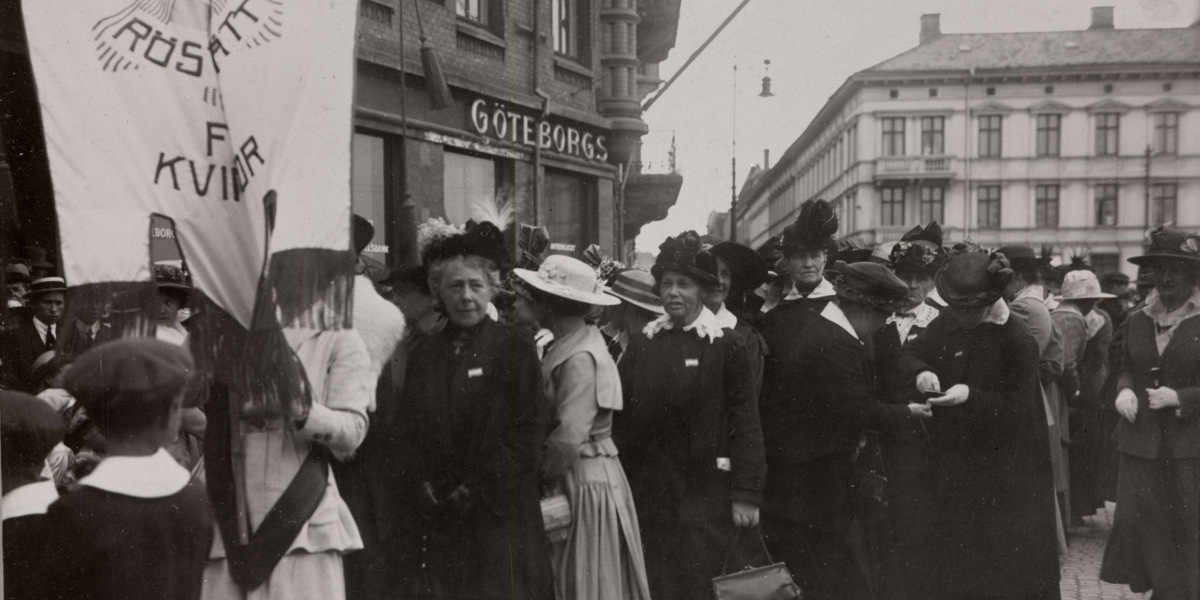
1845 |
Equal inheritance rights for women and men. |
1846 |
Widows, divorcees and unmarried women are entitled to work in manual trades and some commerce. |
1858 |
Unmarried women over 25 years old may attain majority status by court order. Marriage means a return to minority status. |
1859 |
Women are entitled to some teaching positions. |
1863 |
Unmarried women attain majority status at the age of 25. |
1864 |
Husbands lose legal right to strike their wives. |
1870 |
Women gain the right to take high school diplomas at private schools. |
1873 |
Women gain the right to take degrees with some exceptions (doctorate in law and theology). |
1874 |
Married women gain the right to control their own incomes. |
1884 |
Unmarried women attain majority status at the age of 21. |
1901 |
Women gain the right to four weeks of unpaid maternity leave. |
1918 |
All women gain suffrage for municipal elections and the right to hold office at municipal level. |
1919 |
The first municipal election is held in which all women have the right to vote. Women gain national suffrage and the right to hold office at the national level. |
1921 |
The first general election is held in which women have the right to vote. |
| The first five women are elected to the Riksdag. | |
| Married women attain majority status at the age of 21. | |
| The new marriage code gives wives and husbands equal legal status. | |
1925 |
With some exceptions, women gain the same right as men to civil service jobs. |
1927 |
Public upper secondary schools open to girls. |
1931 |
Maternity insurance benefits are introduced. |
1935 |
Equal basic pensions adopted for women and men. |
1938 |
Contraception is legalised through a repeal of the 1910 ban. |
| Child support assistance is established. | |
| Financial assistance to mothers is introduced. | |
| Universal maternity allowance is established. | |
1939 |
Gainfully employed women may not be dismissed, with some exceptions, due to pregnancy, childbirth or marriage. |
1947 |
The first female Cabinet Minister, Karin Kock, is appointed. |
| Equal pay for equal work for state employees. | |
1948 |
Child allowance is introduced. |
1951 |
Women are entitled to retain their Swedish citizenship upon marriage to foreign citizens. |
1955 |
Three months’ paid maternity leave for working women upon the birth of a child. |
1958 |
Women are entitled to be ordained into the clergy. |
1960 |
Employers and unions agree to abolish separate wage rates for women over a five-year period. |
1964 |
Birth control pill approved in Sweden. |
1965 |
Rape within marriage is criminalised. |
1969 |
Compulsory schools adopt a new curriculum. Encouraged to promote equal opportunities. |
1970 |
Secondary schools adopt a new curriculum. Encouraged to promote equal opportunities. |
1971 |
Separate income tax assessment for wife and husband replaces joint taxation. |
1974 |
Parent allowance is introduced, entitling parents to share parental leave upon the birth of a child. |
1975 |
UN’s International Women’s Year. |
| New abortion law: A woman has the right to decide until the 18th week. | |
|
|
Preschool Act. |
1976 |
UN’s Decade for Women commences. |
| An ordinance on equal opportunities in civil service is introduced. | |
| Sterilisation Act. People aged 25 and above decide for themselves. | |
1977 |
Agreement between employers and unions on equal opportunities. |
1979 |
Right to six-hour day for parents of small children. |
1980 |
Law against gender discrimination in employment. |
| The Office of the Equal Opportunities Ombudsman was established. | |
| Sweden accedes to the United Nations Convention on the Elimination of all Forms of Discrimination against Women (CEDAW). | |
| Equal opportunities agreement for municipalities and county councils. | |
| Spouse means test for study aid abolished. | |
| Compulsory schools adopt a new curriculum. Now required to promote equal opportunities. | |
| New law on succession to the throne is introduced. The monarch’s first-born daughter or son succeeds to the throne. | |
1982 |
Assault on private property is subject to prosecution. |
| Ban on pornographic “live shows” in places open to public. | |
| Social security points for at-home care of children under 3 years. | |
| Public funds to women’s organisations. | |
| New Names Act. At time of marriage, couples decide which name or names they will use. | |
1983 |
New equal opportunities agreement between employers and unions. |
1984 |
The State Sector Equal Opportunities Ordinance. |
1985 |
UN’s Decade for Women ends. |
| Strategies for the year 2000 adopted. | |
| Equal opportunities agreement for public companies. | |
1987 |
New law concerning joint property of cohabiting couples (unmarried): The Cohabitation Act. |
1988 |
National 5-year plan of action to promote equal opportunities. |
1989 |
Nordic plan of action to promote equal opportunities. |
| All occupations, including in the armed forces, are open to women. | |
1992 |
New Equal Opportunities Act. |
1993 |
The United Nations General Assembly adopts the Declaration on the Elimination of Violence against Women. |
1994 |
Decision by Parliament to adopt a new national policy for equal opportunities. |
| Gender statistics are included in Sweden’s Official Statistics. | |
1995 |
The UN Fourth World Conference on Women in Peking adopts a declaration and action plan on gender equality. |
| One month of parental leave is reserved for the mother and the father, respectively ("mummy/daddy month") and is non-transferable. | |
| The Act on Registered Partnership is adopted. | |
1998 |
The Act on Violence against Women Penal Code amended. |
| Act on Prohibition against Female Genital Mutilation. | |
| The Equal Opportunities Act is tightened concerning sexual harassment. | |
1999 |
A law prohibiting the purchase of sexual services is adopted. |
2000 |
Special session of the General Assembly, Women 2000: gender equality, development and peace for the twenty-first century. |
| The National Council for Peace for Women is founded. | |
2001 |
A more stringent version of the Equal Opportunities Act comes into force regarding wages and salaries. |
2002 |
Parental leave: number of days increased by 30 sickness benefit days to 480 days, 60 of which are reserved for each parent and cannot be transferred. |
2003 |
Change in law on ban of visitation rights. The ban can also apply to the joint home. |
2004 |
The Swedish Government adopts a strategy for gender mainstreaming in the Government Offices. |
2005 |
New legislation on sexual crimes is adopted. |
2006 |
Decision by Parliament on new objectives for gender equality policy. The European Council adopts the first European Pact for Gender Equality. |
2007 |
The Swedish Government presents a plan for action against men’s violence towards women, honour-related violence and oppression, and violence in same-sex relationships. |
2008 |
The Swedish Government gives the Swedish Association of Local Authorities and Regions (SALAR) funds to support development work on gender mainstreaming in municipalities, county councils and regions. |
2009 |
The Discrimination Act enters into force. Combats, among other things, discrimination on grounds of gender, transgender identity or expression. The Equal Opportunities Act expires. A new agency, the Equality Ombudsman is formed and the Equal Opportunities Ombudsman is discontinued. |
| A gender-neutral Marriage Code is introduced. | |
| The European Institute for Gender Equality is established in Vilnius, Lithuania. | |
2010 |
A change in the law on national service makes conscription gender-neutral. |
2011 |
Sweden signs the Council of Europe Convention on preventing and combating violence against women and domestic violence. |
2013 |
Legislation on sexual offences is made stricter. More cases of sexual exploitation are made punishable as rape. |
| The sterilisation requirement is removed from the Act concerning recognition of gender in certain cases. | |
| The Swedish Government gives some government agencies a special assignment to work on gender mainstreaming, with support from the Swedish Secretariat for Gender Research. | |
2014 |
The Nordic Forum on Women’s rights and gender equality is held. The Swedish Government refers to itself as a feminist government. |
2015 |
The Swedish Government’s commitment to gender mainstreaming among government agencies is expanded. |
2016 |
The number of days of non-transferable parental leave is increased from 60 to 90 days. |
| Single women gain the right to insemination in Sweden. | |
| The Government commissions universities and colleges with the special task of working with gender mainstreaming. | |
| The gender mainstreaming initiative among government agencies is expanded further. | |
| The Equality Days are organised, as the first annual conference focusing on gender mainstreaming. | |
2017 |
New gender equality policy interim goals and the national strategy to prevent and combat men’s violence against women come into force. |
| New regulations are introduced in the Discrimination Act on active measures and wage mapping. | |
| The #metoo movement. | |
2018 |
The Swedish Gender Equality Agency is established. |
| New legislation on sexual crimes is adopted that is based on consent. | |
| The crime of unlawful violation of integrity is introduced. | |
| Qualification targets in male violence against women and domestic violence are introduced for several professional training programmes. | |
| Parliament decides on extended protection in the criminal area for transgender individuals. | |
2019 |
The ILO adopts a convention for eliminating violence and harassment in the world of work. |
2022 |
Introduction of a special crime for honor oppression. Increased punishment for gross violation of a woman's privacy and violation of a no-contact order. |
| Tougher penalties for the purchase of sexual services. | |
| A national violence-prevention programme was introduced. | |
| National Centre against Honour-based Violence and Oppression was established at the County Administrative Board of Östergötland after having had several different commissions in the area for a couple of decades. | |
| Reinforced language regarding sexuality, consent and relationships, as well as honour-based violence and oppression in primary and secondary school curricula. | |
2023 |
New central government grant to strengthen the organisation of girls and women in socio-economically disadvantaged areas. |
| Claudia Goldin was awarded the Sveriges Riksbank Prize in Economic Sciences in Memory of Alfred Nobel "for having advanced our understanding of women’s labour market outcomes". She is the first female solo winner and the third woman ever to receive the prize. | |
2024 |
Sheltered housing became a housing measure under the Social Services Act, and each municipality must be able to ensure access to sheltered housing for victims of violence. |
| New action programme on men's violence against women. | |
| The number of parental insurance “double days,” when both parents can receive parental allowance simultaneously, were doubled, and parents were permitted to transfer 45 days of parental allowance to someone other than the child's parent or cohabitant. |
Parental benefit 1974–2024
Previous editions
Here you can find previous years' editions of "Women and men in Sweden - Facts and figures" in english:
In swedish:
Comments
Other family households include households with children 25 years and older.