Investment Survey, February 2017:
In 2016, Swedish manufacturing industry provided positive surprise and invested heavily
Statistical news from Statistics Sweden 2017-03-10 9.30
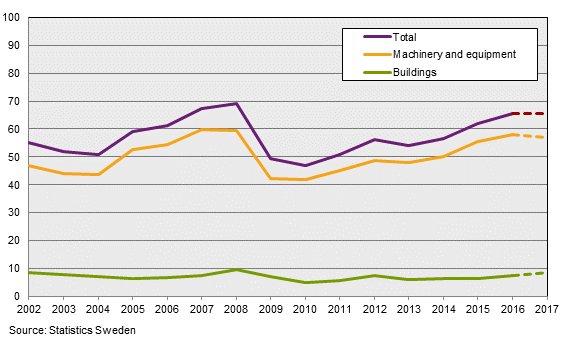
Investment volumes in the manufacturing industry increased by 12 percent in total in 2016. Heavy investments in the pulp and paper industry and the pharmaceutical industry in particular are responsible for the increase. Enterprises’ submitted forecasts point to unchanged investment volumes in 2017.
Volumes in the manufacturing industry (volume is defined as the change in percentage between two years, in 2008 monetary value) increased by 12 percent in 2016 and investments increased by roughly SEK 65 billion (in current prices). Above all, the pulp and paper industry are the driving force, boosting investments by 47 percent compared with 2015. One of the reasons for the expansion investments is probably the desire to improve long-term profitability and competitiveness on the global market. The pharmaceutical industry also stands out as an expansive industry, and in 2016, investments were SEK 2.4 billion, compared with SEK 1.7 billion in 2015 measured in current prices.
Manufacturing enterprises forecast unchanged investment volumes for 2017, which is an upward revision of roughly seven percent compared with Statistics Sweden’s October survey.
Mining fell in 2016
Since its peak in 2012 at roughly SEK 11 billion, the mining industry has decreased investments gradually, probably due to decreased profitability. In 2016, investment volumes decreased by 38 percent compared with 2015. In 2016, investments by the mining industry amounted to SEK 5.1 billion in current prices. However, it appears that the trend of decreasing investments will reverse in 2017, as enterprises forecast one percent in increased investments in 2017 measured in current prices.
Very strong fourth quarter
Information and communication enterprises increased their investment volumes by 27 percent, which is a upward revision by roughly 26 percent compared with the October survey. This, in turn, is due to an upward revision of the fourth quarter by roughly SEK 4 billion in current prices.
Compared with Statistics Sweden’s October survey, the fourth quarter was revised the most. In general, there are upward revisions in most industries, which indicates that the fourth quarter was better than expected.
Outcome 2002-2015, plans 2016–2017. SEK billions, 2008 prices

| Investments in SEK billions in current prices 2016 | Change in volume (base year 2008) | |
|---|---|---|
| Industry | 69.8 | 6 |
| Energy | 37.2 | ‑6 |
| Construction | 7.0 | ‑1 |
| Trade in goods | 14.9 | 4 |
| Transportation and storage* | 13.5 | ‑29 |
| Information and communication | 19.8 | 27 |
| Banks and insurance companies** | 5.3 | ‑8 |
| Business services | 11.4 | ‑4 |
* Prel. Results (Sample 6 is not included in this survey, for more information see SCBDOK.) ** Figures for 2015 have been revised
| Investments in SEK billions in current prices 2017 | Volume change according to enterprises' forecasts | |
|---|---|---|
| Industry | 69.8 | 0 |
| Energy | 43.2 | 16 |
| Construction | 6.6 | ‑7 |
| Trade in goods | 13.6 | ‑10 |
| Transportation and storage | 17.4 | 30 |
| Information and communication | 11.8 | ‑40 |
| Banks and insurance companies | 4.7 | ‑12 |
| Business services | 10.4 | ‑8 |
Definitions and explanations
The population frame is collected from Statistics Sweden's Business Register database. All enterprises with at least 200 employees are included, while enterprises with between 20 and 199 employees are sampled. In some activities, enterprises with between 5 and 199 employees are sampled. Enterprises in the industry sector with between 10 and 19 employees are taxed based on investment information from enterprises with between 20 and 49 employees.
The term "investments" in this survey refers to the acquisition of tangible assets with an estimated life of at least one year, and also reconstruction and improvement work that materially raises capacity, standards and life-length. Investments are divided into buildings and machinery. "Expected investments" refer to concrete investment plans and the renewal of machinery and such not covered by current investment plans but which from experience can be expected to take place.
"Volume" is used to show the change in percent between two years, calculated in the 2008 monetary value and includes, in most cases, assessments (upward or downward adjustments) of enterprises' submitted forecasts. Past experience shows that enterprises' planned investments differ from implemented investments in a partially systematic way.
Information in the Investment Survey differs from the information in the National Accounts, as the national accounts includes more sectors and uses a broader definition of investment that includes purchased and proprietary software, financial leasing of capital items distributed by the utilising industry.
From the May 2009 publication onwards, investment information is reported in accordance with the new Swedish classification of economic activity (SNI 2007). The transition to the new classification of economic activity means that earlier study domains are not completely comparable with today's publication.
Next publishing will be
2017-05-26 at 09:30.
Statistical Database
More information is available in the Statistical Database
Feel free to use the facts from this statistical news but remember to state Source: Statistics Sweden.
