Demographic analysis: Remaining life expectancy by level of education:
Education important for the population’s life expectancy
Statistical news from Statistics Sweden 2017-09-13 9.30
In recent years, life expectancy has been nearly six years higher in the group with post-secondary education than in the group with only compulsory education. Differences in life expectancy among groups with different levels of education have increased in recent years and are greater than the difference in life expectancy between women and men. The group with post-secondary education, which has the highest life expectancy, has increased its share in the population, while maintaining or increasing its lead in life expectancy compared with groups with lower levels of education. This has led to increased life expectancy among the population as a whole in recent years.
Statistics Sweden has updated the time series about remaining life expectancy by level of education at age 30 and age 65. Information is now available for the period 2000–2016.
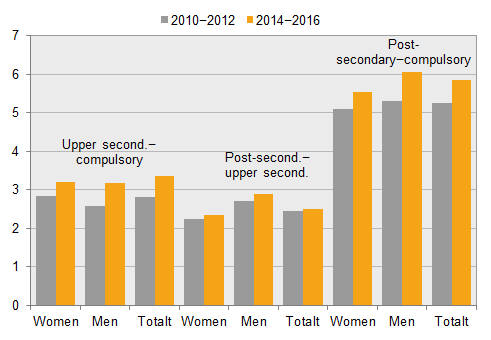
Remaining life expectancy at 30 years was 54.5 years among women and 51.2 years among men in the period 2014–2016. This life expectancy was higher for both sexes compared with 2010–2012. The increase between the periods was slightly larger among men than among women, and the difference between sexes has decreased from 3.5 years to 3.3 years.
| Level of education | Women | Men | Total | ||||
|---|---|---|---|---|---|---|---|
| 2010–2012 | 2014–2016 | 2010–2012 | 2014–2016 | 2010–2012 | 2014–2016 | ||
| At age 30 | |||||||
| Compulsory | 51.4 | 51.3 | 48.1 | 48.0 | 49.7 | 49.5 | |
| Upper second. | 54.3 | 54.5 | 50.7 | 51.2 | 52.5 | 52.9 | |
| Post-second. | 56.5 | 56.9 | 53.4 | 54.1 | 54.9 | 55.4 | |
| Total | 54.1 | 54.5 | 50.6 | 51.2 | 52.4 | 52.9 | |
| At age 65 | |||||||
| Compulsory | 20.3 | 20.5 | 17.6 | 18.0 | 19.0 | 19.3 | |
| Upper second. | 21.4 | 21.7 | 18.7 | 19.1 | 20.1 | 20.4 | |
| Post-second. | 23.0 | 23.2 | 20.2 | 20.7 | 21.5 | 22.0 | |
| Total | 21.1 | 21.5 | 18.4 | 19.0 | 19.8 | 20.3 | |
The statistics refer to persons born in Sweden. The data in a period represents a three-year average value.
Increasing differences among educational groups
Remaining life expectancy in Sweden has increased, regardless whether it is calculated from 30 years or from 65 years. It has also increased in all levels of education from 65 years. However, life expectancy at 30 years has decreased slightly between 2010–2012 and 2014–2016 among both women and men with compulsory education. For both sexes together, the decrease was from 49.7 years to 49.5 years. This can be compared with an increase from 54.9 years to 55.4 years among those with post-secondary education, and from 52.5 years to 52.9 years among those with secondary education. The gap in life expectancy between sexes is closing. However, the difference between groups with different educational levels is increasing, see figure 1. Among groups with post-secondary education and compulsory education, the difference in life expectancy at 30 years is now more than six years among men and 5.5 years among women. The difference between the groups with post-secondary education and secondary education is 2.3 years among women and 2.9 years among men. There is a difference of three years between the groups with secondary education and compulsory education, irrespective of sex.
Differences in years
Life expectancy increased most for the entire population
Men with post-secondary education have had the largest increase in remaining life expectancy at 30 years between 2010–2012 and 2014–2016, from 53.4 years to 54.1 years, an increase of 0.7 years. It is particularly interesting to follow the development of life expectancy among older people, since more than 90 percent of deaths now occur among those aged 30 to 64 years. Also from 65 years, life expectancy increased most for men with post-secondary education, by 0.5 years. It increased the least among women regardless of level of education, over 0.2 years, see figure 2.
Change in years
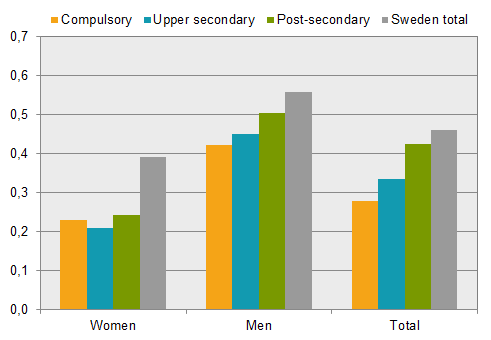
Among men as well as in both sexes together, there is a clear gradient in the change in life expectancy between 2010–2012 and 2014–2016. The increase was smaller in the group with only compulsory education, slightly larger in the group with secondary education and slightly larger still for those with post-secondary education. However, the largest increase was among women and men overall. Among women, the increase in remaining life expectancy at 65 years was in total nearly twice as large, 0.4 years, as each one of the individual education groups, over 0.2 years.
Why has life expectancy increased more among all women and men than in the educational group with the largest increase? Normally, the total value lies somewhere in the middle of the different groups’ values. In table 1, for instance, we can see that the level of the combined remaining life expectancy among women and men lies close to the group in the middle, persons with secondary education, 20.3 years compared with 20.4 years.
Higher level of education contributed to increasing life expectancy in the population
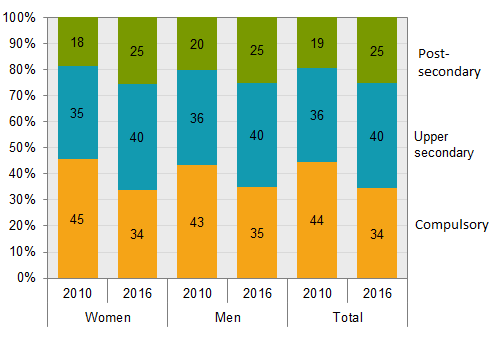
The most credible explanation for remaining life expectancy increasing more among women and men in total than, for instance, among the group with post-secondary education is changes in the population. The share of the population in the group with the shortest remaining life expectancy has clearly decreased in the population over 64 years, from 45 to 34 percent among women and from 43 to 35 percent among men, see figure 3. In recent years, the entire population’s education level has increased, from compulsory to upper-secondary education and from upper-secondary to post-secondary education. The level of education has increased clearly in both sexes, although the increase was slightly larger among women than among men.
An important observation could be that the group with the largest increase in share in the population, persons with post-secondary education, maintained (women) or increased (men, in total) their lead in remaining life expectancy at 65 years compared with groups with lower levels of education.
Percent
Source: Statistics Sweden, Register of Education. The statistics refer to people born in Sweden who were 65 years or older. For a small percentage, about 0.5 percent, there is no information about level of education.
Figure 2 and figure 3 show information for remaining life expectancy from 65 years, although the development looks similar to calculations from 30 years. An important difference is that remaining life expectancy has decreased among women and men with compulsory education due to increased mortality at younger ages. The group with compulsory education has also become relatively small among the younger ages. This makes it difficult to interpret changes in the group with compulsory education when people younger than 65 years are included in comparisons between different education groups’ life expectancy.
Feel free to use the facts from this statistical news but remember to state Source: Statistics Sweden.