Direct investment 2024 – assets and income
Direct investment assets increased both in Sweden and abroad in 2024
Statistical news from Statistics Sweden 2025-11-05 8.00
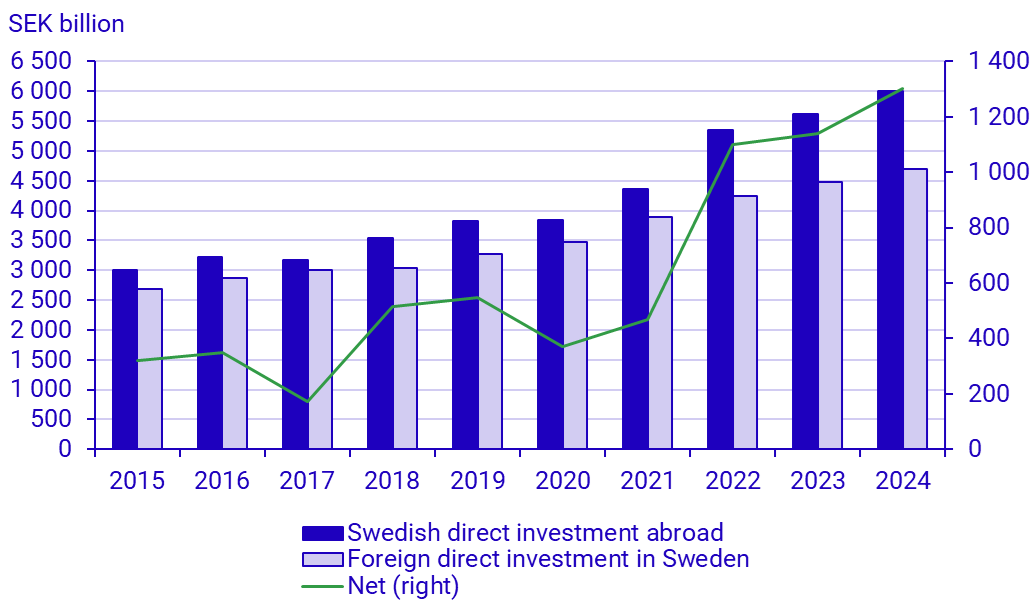
At the end of 2024, the value of Swedish direct investment assets abroad amounted to SEK 6 003 billion, which is an increase of 7 percent compared to the previous year. Foreign direct investment assets in Sweden increased by 5 percent and amounted to SEK 4 701 billion at the end of 2024. Income on Swedish direct investment assets abroad amounted to SEK 561 billion in 2024, which is an increase by 1 percent compared to 2023. In the same period, income on foreign direct investment assets in Sweden increased by 3 percent and amounted to SEK 300 billion.
Swedish direct investment assets abroad increased
Swedish direct investment assets abroad amounted to SEK 6 003 billion at the end of 2024. This is an increase of SEK 384 billion compared with the end of 2023. Equity accounted for SEK 5 336 billion of total Swedish direct investment assets abroad, which was an increase of 8 percent compared with the end of 2023. Net claims against foreign subsidiaries, fellow subsidiaries, and associated companies amounted to SEK 667 billion, a decrease of 3 percent compared with 2023.
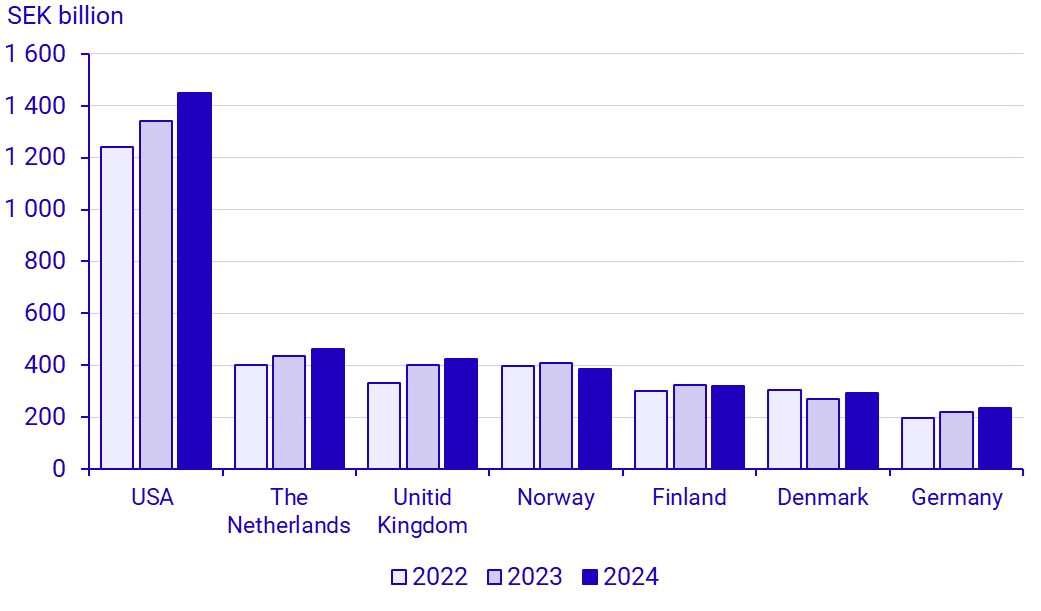
Sweden’s largest direct investment assets abroad are located in the United States. There are also large Swedish direct investment assets in several European countries, such as the Netherlands, the United Kingdom and Norway. Swedish direct investment assets in the United States amounted to SEK 1 448 billion at the end of 2024, which was an increase of SEK 108 billion compared with the end of 2023. The United States was also the country where the Swedish direct investment assets increased most in value in 2024. The largest assets abroad are held by Swedish companies operating in manufacturing “petroleum, chemicals, rubber and plastic products”, as well as by companies operating in the production of ‘’metal and mechanical products’’.
Among total direct investment assets abroad, SEK 45 billion was controlled by “special purpose entities” (SPEs). SPEs are enterprises that are ultimately controlled from abroad and, beyond owning assets and liabilities, have limited activities in Sweden. Reporting SPE data separately provides a useful measure of a country’s incoming and outgoing direct investments, by making it possible to exclude capital that only passes through a country on its way to other destinations.
Development of the Swedish krona
According to the KIX index, the Swedish krona weakened in comparison with other currencies by 3 percent by the end of December 2024, compared to December 2023. The Swedish krona depreciated against the US dollar and euro by 10 and 4 percent respectively. A weakened Swedish krona contributes to increased asset value on Swedish direct investment abroad, expressed in Swedish kronor.
Foreign direct investment assets in Sweden increased
Foreign direct investment assets in Sweden increased by SEK 222 billion at the end of 2024 compared with 2023, and amounted to SEK 4 701 billion. In 2024, equity increased by 8 percent to SEK 4 187 billion. At the end of 2024, net liabilities to foreign owner groups amounted to SEK 514 billion, which was a decrease by 16 percent compared to the end of previous year.
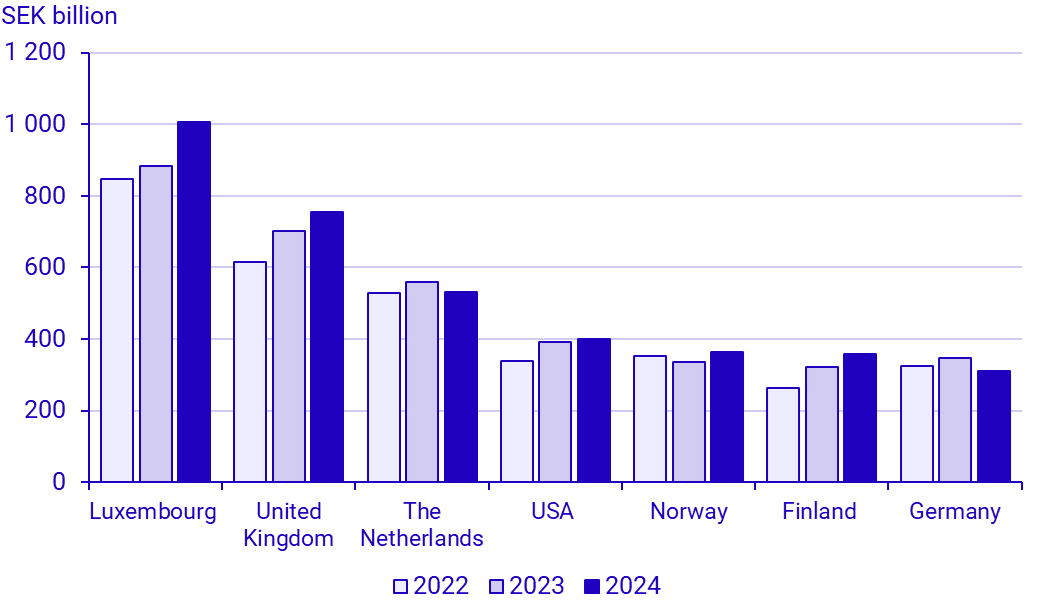
In terms of foreign direct investment assets in Sweden, Luxembourg continued as the largest holder country, followed by the United Kingdom and the Netherlands. Luxembourg’s assets in Sweden amounted to SEK 1 006 billion at the end of 2024, which was an increase by SEK 122 billion compared with the end of 2023. Luxembourg was also the country whose direct investment assets in Sweden increased the most in 2024.
As in the previous year, the largest foreign assets in Sweden are noted in the industry group ‘’financial and insurance activities’’. Companies operating in manufacturing “petroleum, chemicals, rubber and plastic products” increased their assets most in Sweden in 2024. Of the total direct investments in Sweden, investments in Swedish SPEs accounted for SEK 75 billion.
Income increased on direct investment assets
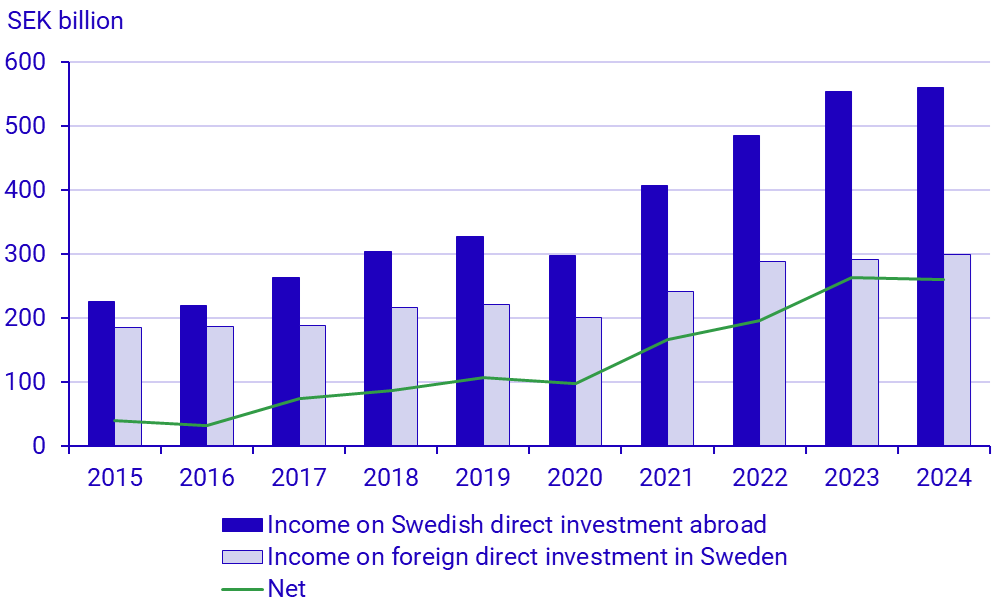
Income on Swedish direct investment assets abroad increased by SEK 6 billion in 2024 compared to 2023 and amounted to SEK 561 billion in total. As in the previous year, companies engaged in the manufacturing of “metal and mechanical products” accounted for the largest income on Swedish direct investment assets. In 2024, income on Swedish direct investment assets abroad was the largest in the United Sates and the Netherlands.
Income on foreign direct investment assets in Sweden increased by SEK 9 billion in a corresponding comparison, and amounted to SEK 300 billion. The highest earnings came from the industry group ‘’financial and insurance activities’’. Companies within this industry group also accounted for the largest share of the overall increase. In 2024, the highest income on foreign direct investment assets in Sweden was linked to assets held by entities from the United Kingdom, the Netherlands and Finland.
Net foreign direct investment earnings, that is the value of income on Swedish direct investment assets abroad less income on foreign direct investment assets in Sweden, contributed SEK 261 billion in 2024 to Sweden’s current account, which is a decrease by 1 percent compared to 2023.
What is direct investment?
A direct investment arises when someone, usually a company, directly or indirectly controls 10 percent or more of the number of votes in a company or commercial property located in another country. The annual direct investment survey measures assets such as total equity, financial claims and liabilities within a direct investment relationship, and directly-owned commercial property. Information on direct investments published in the SCB’s Statistical Database includes holiday homes and internal trade credits. This information is also included in the international investment position, which shows Sweden’s assets and liabilities in relation to other countries.
Income on direct investment is calculated as profit/loss after financial items, adjusted for write-downs (net, including credit losses), capital gains/losses and taxes. Total income, published in the Statistical Database, also includes interest income and costs on direct investment loans, and income on holiday homes. Income on direct investment is booked in the current account.
Statistical Database
More information is available in the Statistical Database
Feel free to use the facts from this statistical news but remember to state Source: Statistics Sweden.