Political Party Preference Survey in May 2017 – Political party preferences:
Political party preferences May 2017
Statistical news from Statistics Sweden 2017-06-07 9.30
The Political Party Preference Survey shows the support of the various parties in different demographic groups. Political party preference does not refer to any specific level of politics and no consideration is taken to whether or not a person will vote. The survey also presents the EU and euro preferences of the electorate.
On 1 June, Statistics Sweden published estimates of election results if there were to be an election in May 2017. Here we present estimates of party preferences in the electorate from the same survey.
The difference between the measurements is:
– Party preference does not refer to any specific level of politics and no consideration is taken to whether or not a person will vote. The results are weighted by region, sex, age, level of education and Swedish/foreign born.
– The “Election today” estimate refers to the results of an election in May. The results are weighted by how people voted in the previous Riksdag election as well as the question of whether a person would vote or not.
The distribution of party preferences among women and men in the electorate are shown below.
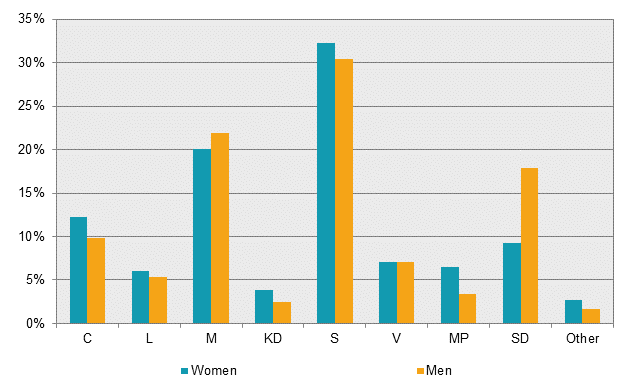
| Party | Women | Men | Total | ||||
|---|---|---|---|---|---|---|---|
| Percent | Margin of error | Percent | Margin of error | Percent | Margin of error | ||
|
C
|
12.2% | ±1.5 | 9.8% | ±1.2 | 11.0% | ±1.0 | |
|
L
|
6.0% | ±1.1 | 5.3% | ±0.9 | 5.7% | ±0.7 | |
|
M
|
20.1% | ±1.8 | 21.9% | ±1.8 | 21.0% | ±1.3 | |
|
KD
|
3.8% | ±0.9 | 2.5% | ±0.6 | 3.1% | ±0.5 | |
|
S
|
32.3% | ±2.1 | 30.4% | ±1.9 | 31.4% | ±1.4 | |
|
V
|
7.1% | ±1.1 | 7.1% | ±1.1 | 7.1% | ±0.8 | |
|
MP
|
6.5% | ±1.1 | 3.4% | ±0.8 | 5.0% | ±0.7 | |
|
SD
|
9.2% | ±1.3 | 17.9% | ±1.7 | 13.5% | ±1.1 | |
|
Other
|
2.7% | ±0.7 | 1.7% | ±0.5 | 2.2% | ±0.5 | |
The stronger and weaker groups of each party are commented on with regard to sex, age, country of birth and level of education. In the table appendix of the Party Preference Survey May 2017, party preference is presented for a number of different groups in the population of eligible voters.
Party preferences in May 2017
Centre Party
In May 2017, 11.0 ± 1.0 percent of eligible voters report that they prefer the Centre Party the most. This is a statistically significant increase compared with November 2016.
Support for the Centre Party is greater among women than among men. However, it is not possible to see any clear differences among age groups concerning supporters for the Centre Party in May 2017. As previously, based on country of birth there is a clear difference in support for the Centre Party. The party clearly has a higher proportion of supporters among Swedish born persons than among foreign born persons. Support for the Centre Party is greatest among people with extensive post-secondary education. Support has doubled in this group since May 2016.
Liberal Party
In May 2017, 5.7 ± 0.7 percent of eligible voters report that they prefer the Liberal Party the most. This is a statistically significant increase compared with November 2016.
There are no apparent differences between the sexes or age groups among supporters of the Liberal Party in May 2017. Also, there is no apparent difference in support between Swedish born persons and foreign born persons. With regard to the level of education, the proportion of supporters in May 2016 was largest among those with post-secondary education.
Moderate Party
In May 2017, 21.0 ± 1.3percent of eligible voters report that they prefer the Moderate Party the most. This is a statistically significant decrease compared with November 2016.
There is no apparent difference between the sexes with regard to supporters for the Moderate Party. However, there are differences among different age groups. In May 2017, support for the Moderate party is greatest among young people aged 18 to 29 years and lowest among those older than 65 years. There are no apparent differences in support between Swedish born persons and foreign born persons. Support for the Moderate Party is greater among those with post-secondary education than with those with compulsory education as their highest level of education.
Christian Democrats
In May 2017, 3.1 ± 0.5 percent of the eligible voters report that they prefer the Christian Democrats the most. This is not a statistically significant change compared with November 2016.
Support for the Christian Democrats is greater among women than among men. However, there are no apparent differences between ages among supporters in May 2017. There are no noticeable differences in support among Swedish born persons and foreign born persons nor based on level of education.
Social Democrats
In May 2017, 31.4 ± 1.4 percent of the eligible voters reported that they prefer the Social Democrats the most. Compared with November 2016, this is not a statistically significant change.
In May 2017, it is not possible to see any clear differences between the sexes in support for the Social Democrats. However, there are differences among different age groups. Support for the Social Democrats is larger among those who are 50 years and older. The party clearly has stronger support among foreign born persons than among Swedish born persons. With regard to the level of education, the Social Democrats have greater support among those with compulsory and upper secondary level education than among those with post-secondary education.
Left Party
In May 2017, 7.1 ± 0.8 percent of eligible voters report that they prefer the Left Party the most. Compared with November 2016, this is not a statistically significant change.
In May 2017, there are no apparent differences between women and men in support for the Left Party. With regard to age, the proportion who support the Left Party is lower among those who aged 65 years and older. It is not possible to see any clear differences in support between Swedish born persons and foreign born persons. With regard to the level of education, support for the Left Party is greater among those with post-secondary education than with those with a lower level of education.
Green Party
In May 2017, 5.0 ± 0.7 percent of eligible voters report that they prefer the Green Party the most. This is not a statistically significant change compared with November 2016.
In May 2017, the Green Party has stronger support among women than among men. With regard to age, the proportion that prefers the Green Party is greatest among those aged 18 to 49 years, and lowest among those aged 65 and older. Support for the Green Party is greater among foreign born persons than among Swedish born persons. With regard to the level of education, support for the Green Party is greater among those with post-secondary education than with those with a lower level of education.
Sweden Democrats
In May 2017, 13.5 ± 1.1 percent of eligible voters report that they prefer the Sweden Democrats the most. Compared with November 2016, this is not a statistically significant change.
In May 2017, as previously, support for the Sweden Democrats is stronger among men than among women. There are no apparent differences in support among the different age groups. Support for the Sweden Democrats is greater among Swedish born persons than among foreign born persons. With regard to the level of education, support is greater among those with compulsory and upper secondary education than among those with post-secondary education.
EU and euro preferences
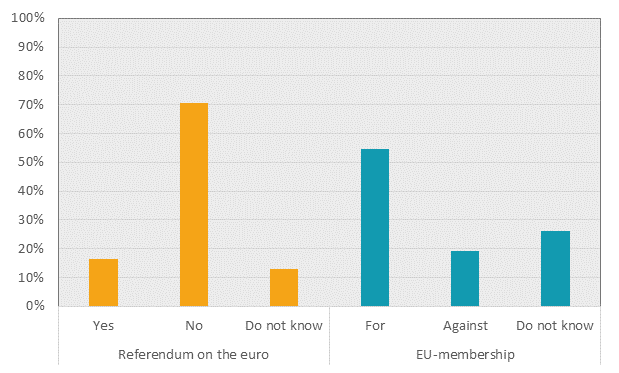
If there were to be a referendum on the euro in May 2016, 16.5 ± 1.1 percent would vote “yes” to the euro and 70.6 ± 1.3 percent would vote “no”. 12.9 ± 1.0 percent say they do not know how they would vote. Compared with November 2016, the proportion that would vote no has decreased. This change is statistically significant.
The proportion of those who say they are mainly in favour of Sweden’s EU membership was 54.5 ± 1.4 percent in May 2017. The proportion against EU membership was 19.2 ± 1.1 percent, and the proportion that did not have an opinion was 26.3 ± 1.3 percent.
Compared with November 2016, the proportion that say they are in favour of EU membership has increased, while the proportion of those who are against membership and those who do not have an opinion has decreased. All of these changes are statistically significant.
Questions:
1. "How would you vote if there were a referendum on replacing the Swedish krona with euro today? Would you vote yes or no on the question: should Sweden introduce the euro as its official currency?"
2. "Are you principally for or against Sweden's membership in the EU or are you undecided?"
For more information about EU and euro preferences, please refer to Sweden’s Statistical Databases (see link below).
Definitions and explanations
The Party Preference Survey in May 2017 was conducted with a national random sample consisting of 8 973 persons entitled to vote in the Riksdag election, without an upper age limit. From the survey in May 2015 onwards, answers are collected from these persons through telephone interviews and web questionnaires. The introduction of this type of mixed collection was conducted under controlled conditions, and analyses of patterns of response were conducted prior to publication. The sample method is exactly the same as previously, with a random sample from the population register. The difference is that the sample persons were given the option to reply via a web questionnaire. If they did not reply via the web questionnaire, they were contacted via telephone later in the collection period. As in previous surveys, all available telephone numbers, both to mobile phones and home phones, have been used to contact the selected persons.
Among the sample persons, 23.7 percent could not be reached (including persons with unlisted telephone numbers and those without telephones), 3.1 percent were too ill to be interviewed and 19.6 percent did not want to be interviewed. The total non-response rate was 46.4 percent. The total number of respondents was 4 808, which corresponds to 53.6 percent. In addition, some persons did not want to answer certain questions. The data was collected during the period from 28 April to 28 May. Non-response is presented in more detail in table 23 in the table publication.
The results are presented in point estimations ± margins of error. The interval that is formed by the percent estimation ± margin of error here is a 95 percent uncertainty interval, which is an interval that with 95 percent probability includes the actual value of the population, if no systematic errors occur.
Publication
In the table appendix of the publication, results are also presented by region, foreign/Swedish background, civil status, children, income, form of housing, occupation, socio-economic group, sector and union membership.
Next publishing will be
Estimates of election results for the Riksdag election in November 2017, the political party preferences and EU/euro preferences will be published in December 2017.
Statistical Database
More information is available in the Statistical Database
Feel free to use the facts from this statistical news but remember to state Source: Statistics Sweden.