Environmental Accounts – Emissions to air third quarter 2023
Emissions from the Swedish economy decrease by 1.8 percent during the third quarter of 2023
Statistical news from Statistics Sweden 2024-02-08 8.00
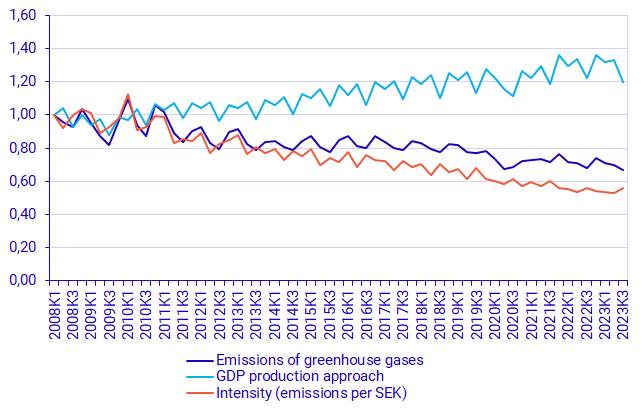
Greenhouse gas emissions from the Swedish economy decrease by 1.8 percent during the third quarter of 2023, compared to the same quarter last year. The reduction in emissions occurs in all industries but mainly in the transport sector.
The quarterly statistics from Statistics Sweden’s Environmental Accounts report production-based air emissions per industry from Sweden's economy, which also include households.
- Preliminary figures show that emissions from the Swedish economy decrease by 1.8 percent during the third quarter. A corresponding decrease in GDP by 1.7 percent can also be observed compared to the same quarter last year, says Frida Hellman, analyst at Statistics Sweden's environmental accounts.
The total greenhouse gas emissions from the Swedish economy amount to 11.6 million tons of carbon dioxide equivalents during the third quarter of 2023. In the same quarter of 2022, greenhouse gas emissions were 11.8 million tons of carbon dioxide equivalents. During the period, Swedish GDP decreased by 1.7 percent. The greenhouse gas intensity, i.e. the emissions of greenhouse gases calculated per economic output, is unchanged.
Changes during the third quarter of 2023 in brief
The percentage changes below are compared with corresponding quarter in the previous year, unless otherwise stated. Emissions refer to greenhouse gas emissions measured in kilotons of carbon dioxide equivalents.
- Emissions from the transport sector decrease by 76 kilotons, which corresponds to a 4.5 percent reduction. The decrease mostly depends on a reduced use of aviation and marine fuels, as well as the use of petrol and diesel by road traffic.
- The manufacturing industry reduces emissions by 1.7 percent, which corresponds to 55 kilotons. The emission reductions come mainly from manufacturing of machinery and vehicles.
- Regarding electricity, gas, and heating plants as well as water, sewage and waste (SNI D35-E39), emissions decrease by 1.0 percent, which corresponds to 13 kilotons.
- The construction sector decreases their emissions by 11 kilotons, which corresponds to an increase of 2.6 percent.
- Emissions from private consumption decrease by 2.1 percent, which is a decrease of 43 kilotons.
- The agriculture, forestry and fishing industries decrease their emissions by 13 kilotons, and the mineral extraction industry reduces emissions by 3 kilotons.
The shifting need for fossil fuels in district heating systems with different weather is the main reason for varying emissions in this sector, both between years and when comparing emissions from different seasons.
| NACE 2007 industry | Greenhouse gas emissions | Value added | |||||
|---|---|---|---|---|---|---|---|
| 2023Q3 |
Change compared to 2022Q3 |
2023Q3 | Change compared to 2022Q3 | ||||
| Agriculture, forestry and fishery | 2 063 | ‑13 | ‑0.6% | 20 480 | ‑1 619 | ‑7.3% | |
| Mining | 204.6 | ‑3 | ‑1.4% | 10 023 | ‑702 | ‑6.5% | |
| Manufacturing | 3 277 | ‑55 | ‑1.7% | 179 379 | ‑13 513 | ‑7.0% | |
| Electricity, gas, heat, water, waste | 1 259 | ‑13 | ‑1.0% | 43 606 | ‑3 613 | ‑7.7% | |
| Construction | 419 | ‑11 | ‑2.6% | 76 482 | 262 | 0.3% | |
| Transport | 1 624 | ‑76 | ‑4.5% | 42 904 | ‑1 483 | ‑3.3% | |
| Other services | 692 | ‑1 | ‑0.2% | 625 573 | 4 027 | 0.6% | |
| Public sector | 84 | ‑1 | ‑0.7% | 212 125 | ‑4 126 | ‑1.9% | |
| Households and non-profit institutions[1] | 1 992 | ‑43 | ‑2.1% | 15 817 | 128 | 0.8% | |
| Total economy[2] | 11 615 | ‑216 | ‑1.8% | 1 226 389 | ‑20 639 | ‑1.7% | |
[1] Only non-profit institutions provide value added. [2] GDP from a production approach (not calendar corrected). Source: Statistics Sweden
Definitions and explanations
What do the quarterly statistics show?
The quarterly statistics from Statistics Sweden's environmental accounts report production-based emissions to air per industry from the Swedish economy, which also includes households. Production-based emissions include emissions of greenhouse gases from Swedish economic actors and differ in that respect from territorial emissions, which relates to national borders and constitute the statistics that are used to follow emission trends in relation to climate goals within the UN, EU and nationally.
Read more about different ways to calculate greenhouse gas emissions: Tre sätt att beräkna klimatpåverkande utsläpp (naturvardsverket.se)
The quarterly statistics cover emissions from Swedish companies and persons, both within as well as outside Sweden's borders. Emissions with the production perspective follow the same system boundary as the national economic statistics, i.e. the national accounts.
For the transport industry, emissions arising from transport companies with economic residence in Sweden are included regardless of where in the world these emissions occur. Emissions from e.g. foreign airlines flying to, from or within Sweden are not included.
When comparing quarters, the reader should be attentive to seasonal variation. For example, emissions from sectors covering electricity, gas, heat, water and waste are higher during the winter, whereas households’ consumption of diesel and petrol are higher during the summer.
Greenhouse gases in terms of carbon dioxide equivalents are calculated as an aggregate of fossil CO2, CH4, N2O, HFCs, PFCs and SF6. The conversion factors (Global Warming Potential, GWP) used to calculate carbon dioxide equivalents are also the factors used for reporting to the UNFCCC[1].
Biogenic CO2 is reported separately and is not included in reported aggregates for greenhouse gases and carbon dioxide equivalents. More information about biogenic CO2 and its climate impact is available on the Swedish Environmental Protection Agency's website:
Biogena koldioxidutsläpp och klimatpåverkan (naturvardsverket.se)
[1] IPCC, 2014: Climate Change 2014: Synthesis Report. Contribution of Working Groups I, II and III to the Fifth Assessment Report of the Intergovernmental Panel on Climate Change [Core Writing Team, R.K. Pachauri and L.A. Meyer (eds.)]. IPCC, Geneva, Switzerland, 151 pp, AR5 Synthesis Report - Climate Change 2014 (ipcc.ch)
Revisions
For the third quarter of 2023, following revisions have been applied since the previous publication:
- During the third quarter of 2023, emissions from aviation have been calculated by using deliveries of jet fuel to Swedish airports. When quality-assured data is again made available, the aviation emissions statistics will be recalculated using OECD data, which was used during the previous year.
More information on these updates is available at Miljöräkenskaper (scb.se) under the heading (in Swedish): Dokumentation.
Next publishing will be
The next statistical news on quarterly emissions to air for the fourth quarter of 2023, is scheduled for May 23rd 2024.
Statistical Database
More information is available in the Statistical Database
Feel free to use the facts from this statistical news but remember to state Source: Statistics Sweden.