Environmental accounts - Economy-wide material flow accounts 1998–2019
Biomass extraction increased again in 2019 after the draught in 2018
Statistical news from Statistics Sweden 2020-12-11 9.30
The increasing trend in natural resource extraction continued following a slowdown in 2018 due to drought. In 2019, 265 million tonnes of natural resources were extracted and material consumption amounted to 266 million tonnes.
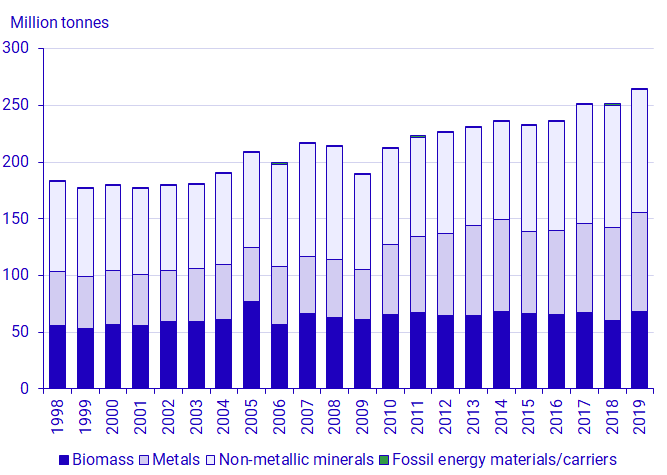
Large quantities of natural resources are extracted every year in Sweden for domestic use or export. In 2019, 265 million tonnes of natural resources were extracted, which is the largest total since the beginning of the time series in 1998. The rate of increase slowed in 2018 due to crop failure, brought on by a summer drought. However, the increase rate recovered in 2019.
Non-metallic minerals is the largest material category, and accounted for 109 million tonnes in domestic extraction in 2019, of which 100 million tonnes was sand and gravel. Extraction of metal ores amounted to 87 million tonnes in 2019, the most important of which were iron ore (39 million tonnes), copper ore (32 million tonnes), and gold and silver ore (12 million tonnes). In 2019, extraction of biomass amounted to 69 million tonnes, and consisted mainly of timber (40 million tonnes).
There is an increasing trend in the extraction of all material categories. The largest increase can be seen in biomass extraction, which increased by 13 percent in 2019 compared with the draught year 2018. In 2019, the extraction of metal ores and non-metallic minerals increased by 6 and 1 percent respectively, compared with 2018.
Certain events leave clear impressions in the statistics, such as the storm Gudrun, which led to a temporary large increase in timber extraction in 2005, and the international financial crisis, which led to a sharp decline in most categories in 2009 due to falling demand. The severe drought in the summer of 2018 also left a clear impression, as crops of cereals, pulses, oilseed crops and straw failed, which led to a drop in biomass extraction.

Source: Environmental Accounts, Statistics Sweden
Domestic material consumption
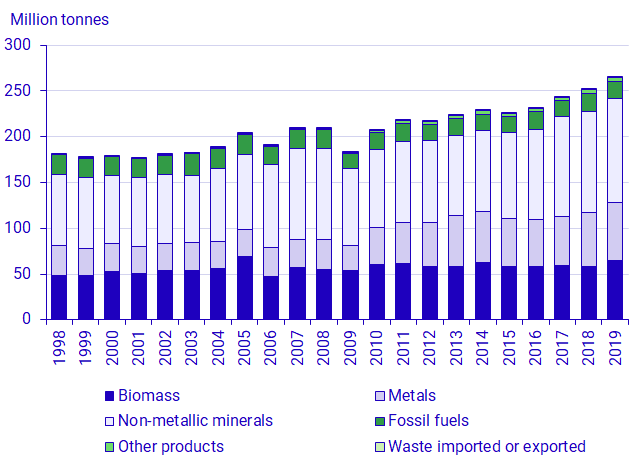
Domestic material consumption is defined as domestic extraction plus imports, minus exports. Total domestic material consumption increased by 5 percent compared with 2018 and by 46 percent compared with 1998, and amounted to 266 million tonnes in 2019.
Domestic material consumption of non-metallic minerals (that is, mostly sand and gravel), was 114 million tonnes in 2019, up by 3 percent compared with 2018 and by 47 percent compared with 1998. Consumption of metals has increased by 7 percent in 2019 compared with 2018 and by 90 percent compared with 1998, and amounted to 63 million tonnes in 2019.
Consumption of biomass was 65 million tonnes in 2019, which is 12 percent more than in 2018 and 34 percent more than in 1998. Consumption of fossil fuels has decreased somewhat compared with 2018 and has decreased by 17 percent compared with 1998, amounting to 18 million tonnes in 2019.
The “other products” and “waste” categories have increased considerably compared with 1998, albeit from low levels. In 2019, consumption of other products was 4 million tonnes, and waste amounted to 0.7 million tonnes.

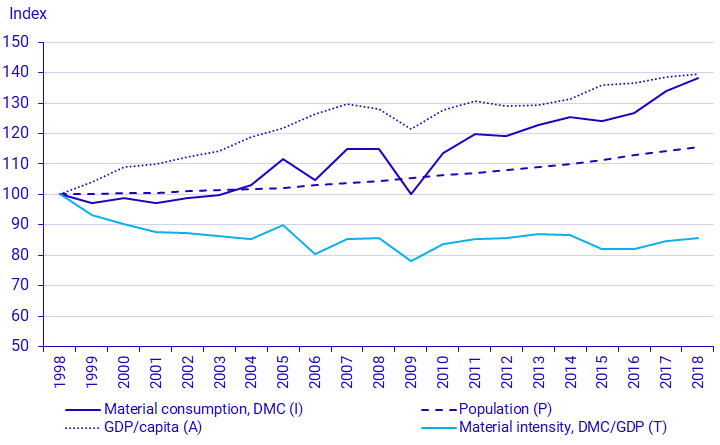
Source: Environmental Accounts, Statistics Sweden Note: This is an application of the “IPAT” equation, which describes what drives material consumption. IPAT stands for: I (Impact) = P (Population) * A (Affluence) * T (Technology). The diagram description explains how the factors are linked to the different parts of the equation in parenthesis.
Driving factors for material consumption
Some factors that affect the material consumption development include how much material is needed per product, which can be described as a material intensity (material consumption/GDP), how much is produced per person (GDP per capita) and the size of the population. The figure below shows that material intensity in Sweden has decreased over time, but has increased somewhat in recent years. The Swedish population and GDP per capita has increased over time. In total, material consumption has increased by almost 40 percent in the period 1998-2018.

Source: Environmental Accounts, Statistics Sweden
Definitions and explanations
The consumption of natural resources can be monitored in the system of economy-wide material flow accounts (EW-MFA). One of the main indicators of the EW-MFA is domestic material consumption (DMC), which measures the amount of material extracted in the country, plus imports minus exports.
Material flows are divided into the following main material categories: biomass, metals, non-metallic minerals (mainly sand and gravel), fossil fuels, other products and waste. These are further divided into 40 subcategories.
The EW-MFA is used to measure the resource productivity of a country’s economy, and to examine the relationship between resource consumption and the GDP in comparisons between different countries’ environmental performance. For instance, the DMC indicator is used in the EU Roadmap to a Resource Efficient Europe (see link below).
Since 2013, the EW-MFA has been included in the EU regulation on environmental accounts (see link below), which means EU Member States are obliged to report statistics on their material flows to the EU.
Information on domestic extraction, imports and exports, and material consumption by material category is available in the Statistical Database. A file containing basic data and more figures is also available for download on the product page (link under “More about the results” at the top of this page).
Next publishing will be
2021-12-15, 09:30.
Statistical Database
More information is available in the Statistical Database
Feel free to use the facts from this statistical news but remember to state Source: Statistics Sweden.
