Environmental Accounts - Emissions to air fourth quarter 2022
Greenhouse gas emissions from the Swedish economy decrease in 2022
Statistical news from Statistics Sweden 2023-05-11 8.00
Greenhouse gas emissions from the Swedish economy decrease by 3 percent in 2022 compared to 2021. This decrease is visible in several sectors, but it is mostly a result of reduced emissions from passenger cars used by households, as well as reduced emissions in the manufacturing sector and the energy sector.
- Our preliminary statistics on greenhouse gas emissions from Sweden’s economy in 2022 show a reduction in emissions by 1.5 million tonnes compared to the previous year. This happens after the emissions increased in 2021 from the low emission levels which were recorded in 2020 when the covid-19 pandemic started. In 2022, an emission reduction occurs in all sectors except the transport sector, where we still have an increasing trend, says Axel Ehrling, analyst at Statistics Sweden’s Environmental Accounts.
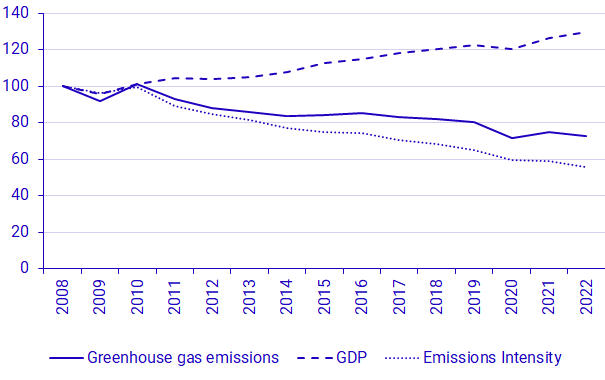
Emissions from the entire Swedish economy decrease by 3 percent in 2022 compared to 2021, amounting to 49.5 million tonnes of carbon dioxide equivalents. These figures are based on preliminary statistics for the year 2022 and are calculated as the sum of all four quarters. In the same period, GDP increases by 2.6 percent. This means that the emission intensity, which measures emissions per SEK value added, also continues decreasing.
Both 2020 and 2021 were years marked by the covid-19 pandemic, which had a visible effect on emissions. In 2021, emissions increased compared to the previous year, but a reduction in emissions is already shown in 2022. Comparing the greenhouse gas emissions in 2022 with the year before the pandemic, i.e., 2019, the emissions are 9 percent lower.
Changes in 2022 in brief
A reduction in greenhouse gas emissions occurs in several sectors, such as the manufacturing sector and the energy sector, as well as in households’ fuel consumption. The percentage changes, given below, are in comparison with the previous year unless otherwise stated. Emissions refer to greenhouse gas emissions measured in kilotons of carbon dioxide equivalents unless otherwise stated.
- Emissions from the transport industry (NACE H49-H53) increase overall by 780 kilotons, which corresponds to an increase of 12 percent. The air transport industry (NACE H51) accounts for the largest increase in emissions. Emissions from shipping companies (NACE H50) also increase. However, there is a decrease in emissions from the road transport sector.
- Emissions from private consumption decrease by 7 percent, which is a decrease of 610 kilotons. This is mainly due to reduced greenhouse gas emissions from diesel use in private transport.
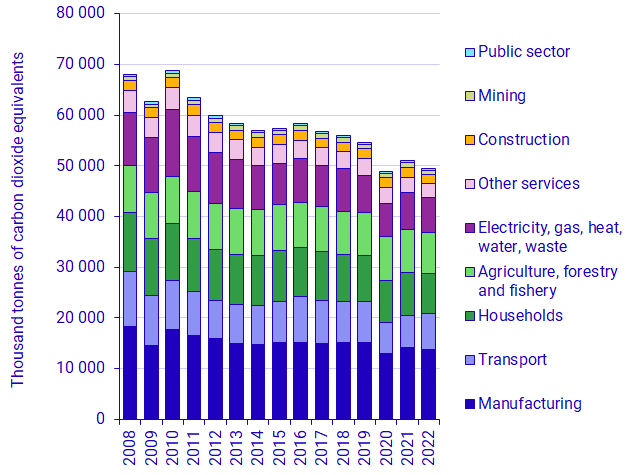
- Emissions from the manufacturing sector (NACE C10-C33) decrease by 3 percent, which corresponds to 450 kilotons. At the same time, the value added in the manufacturing sector increases by 9 percent. The emissions reductions are mainly occurred in refineries, chemical production and pharmaceuticals (NACE C19-C21) and the rubber and plastic goods industry (NACE C22-C23).
- In electricity, gas and heating production as well as water, sewage and waste treatment and management (NACE D35-E39) the emissions are reduced by 5 percent, which corresponds to 390 kilotons.
| NACE 2007 industry | Greenhouse gas emissions | Value added | |||||
|---|---|---|---|---|---|---|---|
| 2022[1] | Change compared to 2021 | 2022[1] | Change compared to 2021 | ||||
| Agriculture, forestry and fishery | 8 263 | ‑192 | ‑2% | 70 231 | 2 223 | 3% | |
| Mining | 864 | ‑18 | ‑2% | 48 928 | ‑1 853 | ‑4% | |
| Manufacturing | 13 798 | ‑448 | ‑3% | 671 921 | 55 782 | 9% | |
| Electricity, gas, heat, water, waste | 6 887 | ‑388 | ‑5% | 188 804 | 4 034 | 2% | |
| Construction | 1 722 | ‑249 | ‑13% | 314 470 | 2 987 | 1% | |
| Transport | 7 065 | 781 | 12% | 2 327 788 | 120 420 | 5% | |
| Other services | 2 732 | ‑349 | ‑11% | 183 595 | 19 921 | 12% | |
| Public sector | 367 | ‑32 | ‑8% | 59 864 | 2 525 | 4% | |
| Households and non-profit institutions[2] | 7 826 | ‑611 | ‑7% | 970 188 | 21 488 | 2% | |
| Total economy[3] | 49 523 | ‑1 507 | ‑3% | 5 606 359 | 144 319 | 3% | |
[1] Greenhouse gas emissions and value added are preliminary and calculated based on summed quarters [2] Only non-profit institutions provide value added. [3] GDP from a production approach (not calendar corrected). Source: Statistics Sweden
Changes in the fourth quarter of 2022 in brief
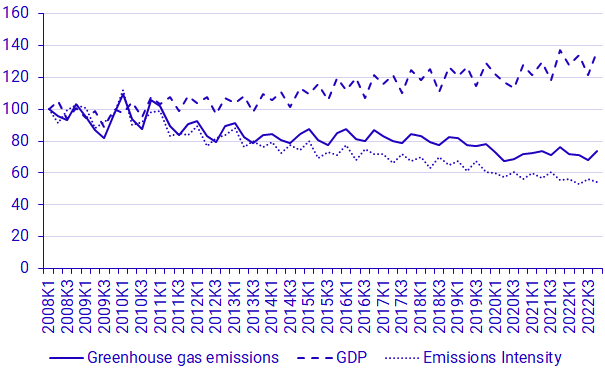
Greenhouse gas emissions from the entire Swedish economy amount to 12.8 million tonnes of carbon dioxide equivalents in the fourth quarter of 2022. This corresponds to an emission reduction of 3 percent compared to the corresponding quarter of the previous year. During the same period, GDP is largely unchanged (decreased just by 0.2 percent).
The emission reductions compared to the corresponding quarter of the previous year are mainly occurred in the manufacturing industry (NACE C10-C33), in the industries of (including electricity, gas, heat production, water, sewage and waste treatment NACE D35-E39) and from households’ transport fuel use. At the same time, greenhouse gas emissions from the transport industry (NACE H49-H53) increase.
Definitions and explanations
What do the quarterly statistics show?
The quarterly statistics from Statistics Sweden's environmental accounts report production-based emissions to air per industry from the Swedish economy, which also includes households. Production-based emissions are emissions of greenhouse gases by Swedish economic actors. The statistics include the emissions from Swedish companies and individuals that occur both outside and inside Sweden's borders. Production-based emissions use the same system boundary as the national economic statistics, i.e., the national accounts.
For the transport industry, emissions arising from transport companies with economic residence in Sweden are included, regardless of where in the world these emissions occur. Emissions from, e.g., foreign airlines flying to, from or within Sweden are not included.
When comparing quarters, the reader should be attentive to seasonal variation. For example, emissions from electricity, gas, heat, water, waste are higher during the winter whereas households’ consumption of diesel and petrol are higher during the summer.
Greenhouse gas emissions – carbon dioxide equivalents are calculated as an aggregate of CO2 (fossil), CH4, N2O, HFC, PFC, SF6. The conversion factors (Greenhouse Warming Potential, GWP) used to calculate carbon dioxide equivalents are the same as those used for reporting to UNFCCC.
Revisions
For the fourth quarter of 2022, several revisions have been applied since the previous publication, which are mainly due to new data from annual calculations for 2021. This leads to revisions in the entire time series. Some key updates are:
- The emissions are reported this year according to the IPCC's Fifth Assessment Report, unlike the publication of the previous year where the emissions were reported according to the IPCC's Forth Assessment Report. This mainly affects the calculation of CH4 and N2O to carbon dioxide equivalents.
- Emissions from H50, shipping companies from the reference year 2018 and onward are calculated based on the Traffic Analysis’ time series of Swedish ship calls in Swedish ports between 2018 and 2021: Shipping goods (trafa.se)
- There have been changes in the emission factor and biomass content in municipal waste. A new calculation of greenhouse gases has been applied.
More information on these updates is available at Miljöräkenskaper (scb.se) under the heading (in Swedish): Dokumentation.
Next publishing will be
The next statistical news on quarterly emissions to air for the first quarter of 2023, is scheduled for 31th August 2023.
Statistical Database
More information is available in the Statistical Database
Feel free to use the facts from this statistical news but remember to state Source: Statistics Sweden.