Environmental Accounts – Emissions to air Q1 2022
Greenhouse gas emissions from Sweden’s economy unchanged in the first quarter of 2022
Statistical news from Statistics Sweden 2022-09-01 8.00
Greenhouse gas emissions from Sweden’s economy were almost unchanged in the first quarter of 2022 compared with the same quarter in 2021. Emissions decreases in the manufacturing and energy sectors were counterbalanced by increased in the transport sector, specifically aviation.
Statistics on greenhouse gas and other air emissions from Sweden’s economy for the first quarter of 2022 are now available from SCB environmental accounts. The statistics are classified according to economic activity and include emissions from all Swedish economic actors, including households.
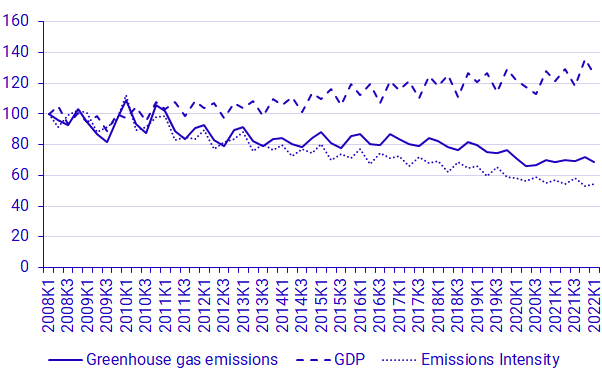
In the first quarter of 2022, total greenhouse gas emissions from Sweden’s economy were 11.92 million tonnes of carbon dioxide equivalents. This is almost unchanged compared with 11.99 million tonnes of carbon dioxide equivalents the same quarter in 2021. Sweden’s GDP increased over the same period by 3.5 percent.
Greenhouse gas intensity, that is greenhouse gas emissions per Swedish krona of production in the economy, decreased by 3.9 percent in first quarter of 2022.
Source: Statistics Sweden.
Reduced greenhouse gas emissions from the energy sector and manufacturing industry
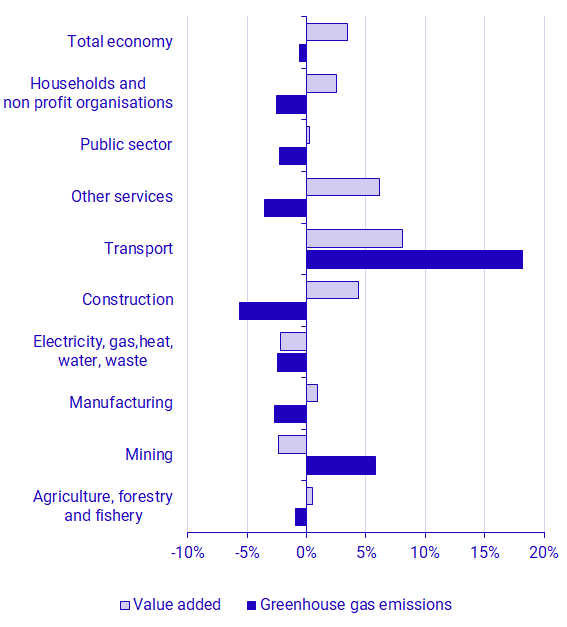
Greenhouse gas emissions decreased in many sectors in the first quarter of 2022 compared with the same period in 2021.
The largest decrease was in the manufacturing industry, where emissions in the first quarter of 2022 were 92 thousand tonnes of carbon dioxide equivalents lower than in the same quarter in 2021, a decrease of 2.7 percent. At the same time economic production (measured as value added) increased by 0.9 percent. Emissions from the energy sector decreased by 2.4 percent, an absolute decrease of 50 thousand tonnes of carbon dioxide equivalents. Value added in the energy sector also decreased by 2,2 percent over the same time interval. Greenhouse gas emissions decreased by 22 thousand tonnes of carbon dioxide equivalents from the construction sector in the first quarter of 2022 while value added increased by 4.3 percent.
The largest increase occurred in the transport sector, where greenhouse gas emissions increased by 18 percent. Value added increased in the sector by 8.1 percent over the same time interval. The transport sector includes aviation, maritime transport and road transport. Aviation stood for most of the increase. The transport sector’s greenhouse gas emissions were still 26 percent lower in the first quarter of 2022 compared with the first quarter of 2019.
Source: Statistics Sweden.
| NACE 2007 industry | Greenhouse gas emissions | Value Added | ||||
|---|---|---|---|---|---|---|
| 2022Q1 | Change compared to samer quarter 2021 | 2022Q1 | Change compared to same quarter 2021 | |||
| Agriculture, forestry and fishery | 2 118 | ‑20 | ‑0.9% | 18 232 | 95 | 0.5% |
| Mining | 224 | 12 | 5.8% | 13 955 | ‑336 | ‑2.4% |
| Manufacturing | 3 381 | ‑92 | ‑2.7% | 186 145 | 1 718 | 0.9% |
| Electricity, gas, heat, water, waste | 1 995 | ‑50 | ‑2.4% | 46 187 | ‑1 038 | ‑2.2% |
| Construction | 372 | ‑22 | ‑5.6% | 79 525 | 3 314 | 4.3% |
| Transport | 1 176 | 181 | 18.2% | 42 866 | 3 201 | 8.1% |
| Other services | 709 | ‑26 | ‑3.5% | 555 932 | 32 094 | 6.1% |
| Public sector | 101 | ‑2 | ‑2.3% | 258 178 | 654 | 0.3% |
| Households and non-profit institutions [1] | 1 844 | ‑48 | ‑2.6% | 14 228 | 351 | 2.5% |
| Total economy [2] | 11 921 | ‑67 | ‑0.6% | 1 359 300 | 45 527 | 3.5% |
[1] Only non-profit institutions provide value added. Source: Statistics Sweden. [2] GDP with a production approach.
Definitions and explanations
The System of Environmental Economic Accounting (SEEA) is constructed using the national accounts as a foundation and presents environmental and economic statistics in a common system. The SEEA makes it possible to analyse interactions between the economy and the environment. The starting point is Swedish economic actors’ environmental pressures, irrespective of where in the world they occur.
The statistics produced here use a production perspective. This means that emissions are allocated to the actor and sector that produces the emissions. Indirect emissions arising due to imports and other consumption are not included.
The statistics produced here are not used directly to measure emissions in relation to nationally and internationally agreed climate targets. Statistics with a territorial perspective are used for that purpose. More information about different perspectives for emissions accounting is available on the Swedish Environmental Protection Agency’s website (in Swedish):
Tre sätt att beräkna klimatpåverkande utslapp
A residence adjustment is applied to adapt statistical sources with a territorial perspective used as an input in the production of these statistics to the national and environmental accounts’ economic perspective. The residence adjustment applies primarily to transport: heavy-duty road transport (primarily within H49 land transport companies, but also other industries, such as construction), water transport (H50) and air transport (H51). The residence adjustment for heavy-duty road transport is based on data on transport work (in tonne-km) for Swedish companies abroad and foreign companies in Sweden, with data from Transport Analysis (Trafikanalys). For water transport and air transport, the residence adjustment is based on data for Swedish companies’ expenditure on fuel from Statistics Sweden’s database on intermediate use in the economy, PRIOR.
Emissions and sequestration due to land use (LULUCF) and carbon dioxide capture and storage (CCS) are not included in the statistics.
Modelling assumptions for mobile emissions
For the reference periods 2008 Q1 – 2017Q4 and 2020Q1 onwards, the air emissions for non-road machinery, road transport and aviation have been calculated with the monthly fuel, gas and inventory statistics as a source. For reference periods 2018Q1 – 2019Q4 the register of reports to the Swedish Energy Agency in accordance with Sweden’s implementation of the EU’s Renewable Energy Directive (2009/28/EC) have been used to calculate the air emissions from these sources. The reason for returning to the monthly fuel, gas and inventory statistics as a source beginning 2020Q1 and onwards is that producers of these statistics assess the data for those time periods to be of high quality. Comparisons between the period 2018Q1 – 2019Q4 and other periods in the time series should therefore be done with care.
Next publishing will be
The next statistical news on quarterly emissions to air for the second quarter of 2022, is scheduled for 27th October 2022.
Statistical Database
More information is available in the Statistical Database
Feel free to use the facts from this statistical news but remember to state Source: Statistics Sweden.