Environmental accounts - Economy-wide material flow accounts 1998–2021
Stagnant extraction of natural resources in 2021
Statistical news from Statistics Sweden 2022-12-15 8.00
The upward trend for domestic material extraction has slowed down since 2019. In 2021, 266 million tonnes of natural resources were extracted in Sweden, an increase of just under one percent compared to 2020. Domestic material consumption amounted to 259 million tonnes, which corresponds to 24.9 tonnes per person and an increase of 2 percent compared to 2020.
- The effect of the coronavirus pandemic is clearly evident and, just like during the financial crisis, there is a small notch in the curve of material consumption in 2020, when mainly the material consumption of biomass and of metals decreased, says Axel Ehrling, analyst at Statistics Sweden's environmental accounts.
Domestic extraction
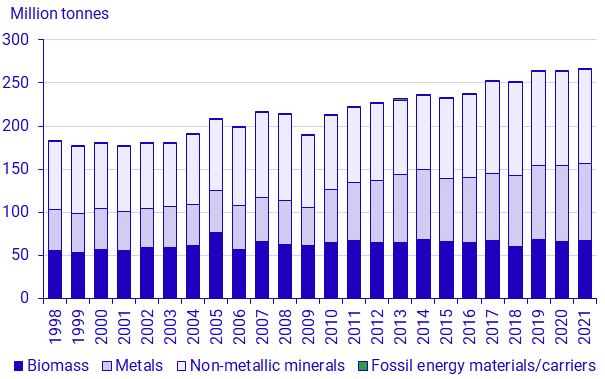
Every year large quantities of natural resources are extracted from the Swedish nature, either for domestic use or for export. In 2021, 266 million tonnes of natural resources were extracted. That is the largest total since the beginning of the time series in 1998. However, the rate of increase has slowed since 2019.
Non-metallic minerals is by far the largest material category in domestic extraction, accounting for 110 million tonnes in 2021, of which 101 million tonnes are sand and gravel*. This is followed by extraction of metal ores, 89 million tonnes, where the most important among these metal ores are iron ore (41 million tonnes), copper ore (34 million tonnes), and gold and silver ore (10 million tonnes). In 2021, extraction of biomass amounted to 67 million tonnes, and consists mainly of timber (41 million tonnes).
Certain events leave clear impressions in the statistics, such as the storm Gudrun, which led to a temporary large increase in timber extraction in 2005. The international financial crisis led to sharp reductions in several categories in 2009 due to falling demand. The severe drought in the summer of 2018 also led to reduced harvests of crops of cereals, pulses, oilseed crops and straw, which is the reason why biomass extraction decreased that year.
*Data on sand and gravel are based on 2020’s values.

Source: Environmental Accounts, Statistics Sweden
Domestic material consumption
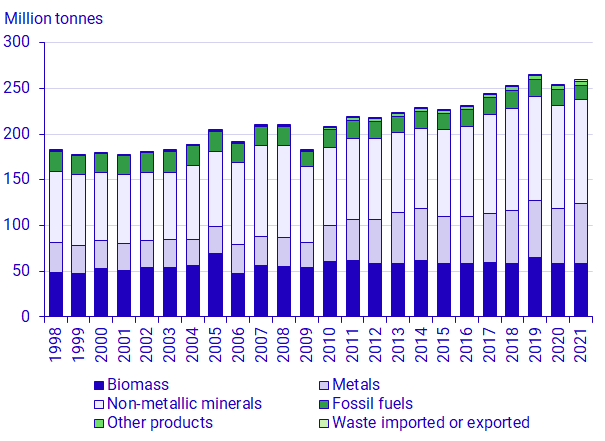
Domestic material consumption is defined as domestic extraction plus imports minus exports. Overall, domestic material consumption increased by 2 percent compared to 2020 and by 39 percent compared to 1998, and amounted to 259 million tonnes in 2021. The year 2020 was marked by the coronavirus pandemic, which affected material consumption mainly through reduced imports.
Domestic material consumption of non-metallic minerals, that is mostly sand and gravel, was 114 million tonnes in 2021. It is unchanged compared to 2020, but up 47 percent since 1998. Consumption of metals increased by 8 percent compared to 2020 and by 96 percent compared to 1998. In 2021, consumption of metals amounted to 65 million tonnes.
Consumption of biomass was 59 million tonnes in 2021, which is unchanged from 2020, but increased by 22 percent since 1998. Consumption of fossil fuels has decreased by 11 percent in 2021 compared to 2020 and by 31 percent compared to 1998. In 2021, 15 million tonnes of fossil fuels were totally consumed.
The categories of other products and of waste have increased considerably since 1998, albeit from low levels. In 2021, the consumption of other products was 5 million tonnes, and waste amounted to 2 million tonnes.

Source: Environmental Accounts, Statistics Sweden
Driving factors for material consumption
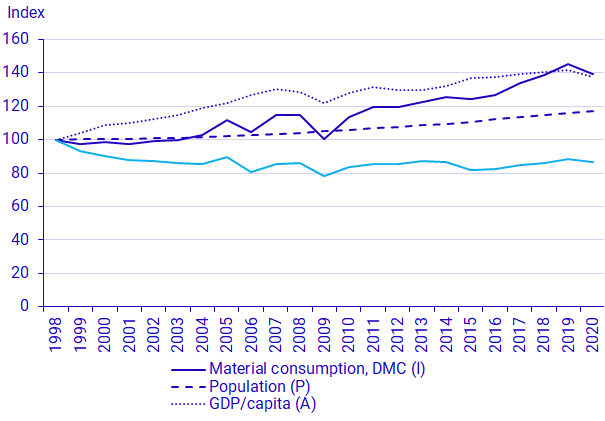
Some factors that affect the development of material consumption are how much material is needed per product, which can be described as a material intensity (material consumption/GDP); how much is produced per person (GDP per capita), and how large the population is. The figure below shows that the material intensity in Sweden has a declining trend over time, but has increased somewhat in recent years. The population in Sweden is steadily increasing and GDP per capita has increased over time. In total, the material consumption has increased by 39 percent in the period from 1998 to 2020. Furthermore, there is currently no trend that indicates that the material consumption is decoupled from the economic development.

Source: Environmental Accounts, Statistics Sweden Note: This is an application of the “IPAT” equation, which describes what drives material consumption. IPAT stands for: I (Impact) = P (Population) * A (Affluence) * T (Technology). The diagram description explains how the factors are linked to the different parts of the equation in parenthesis.
Material footprint
In the fall of 2022, Statistics Sweden produced statistics on circular economy, which included material footprint. The material footprint describes how much raw materials are used upstream along the entire production chain in Sweden and globally, as a result of Swedish consumption (household consumption, public consumption and investments). The material footprint is also called raw material consumption (RMC). For more information see: Circular economy Cirkulär ekonomi (scb.se)
Definitions and explanations
The consumption of natural resources can be monitored in the system of economy-wide material flow accounts (EW-MFA). One of the main indicators of the EW-MFA is domestic material consumption (DMC), which measures the amount of material extracted in the country, plus imports minus exports.
Material flows are divided into the following main material categories: biomass, metals, non-metallic minerals, fossil fuels, other products and waste. These are further divided into 40 subcategories.
The EW-MFA is used to measure the resource productivity of a country’s economy, and to examine the relationship between resource consumption and the GDP in comparisons between different countries’ environmental performance. For instance, the DMC indicator is used in the EU Roadmap to a Resource Efficient Europe.
Since 2013, the EW-MFA has been included in the EU regulation on environmental accounts, which means EU Member States are obliged to report statistics on their material flows to Eurostat.
Information on domestic extraction, imports and exports, and material consumption by material category is available in the Statistical Database of Statistics Sweden. A file containing basic data and more figures is also available for download on the product page (link under “More about the results” at the top of this page).
Next publishing will be
The next publication is scheduled for 2024.
Statistical Database
More information is available in the Statistical Database
Feel free to use the facts from this statistical news but remember to state Source: Statistics Sweden.
