Environmental accounts – Emissions to air 2014:
Emissions of greenhouse gases decreasing but differences between counties are large
Statistical news from Statistics Sweden 2016-12-06 9.30
Emissions of greenhouse gases from the Swedish economy and households decreased from 2008 to 2014, but there are differences between counties. This became clear when Statistics Sweden for the first time presented regional environmental accounts and environmental economic profiles at county level. Gotland is the most emission intensive county among the 21 counties. The largest decrease in emission intensity, “decoupling”, is in Gotland and Södermanland.
The Environmental accounts at Statistics Sweden can now present new and more in-depth statistics for emissions to air. Statistics on greenhouse gas emissions and emissions of air pollution presented by industry were previously only available at national level. They are now available at regional and municipality level. The use of population, employment and economic statistics enables new ways of presenting statistics on emissions to air by putting them in relation to one another. The combination highlights the relationship between the population and air emissions, and contributions made by companies towards the economy, and how they impact the environment.
The statistics are presented in the form of emissions, emission intensities and environmental economic profiles. The statistics follow the national accounts framework and the link between the emissions and the economic activity shows who is responsible for the emissions. This does not necessarily mean that emissions have taken place in the specific region, but rather that the responsible actor is located there.
Gotland is the most emission-intensive county in Sweden. The main bulk of emissions of greenhouse gases from its economy stems from primary industry with large process emissions. However, the service industry and public sector provide the largest contributions to the economy in Gotland. From 2008 to 2014, the reduction in emission intensity, or decoupling, of the Gotland economy, was 26 percent. This was largely due to strong economic growth in service industries.
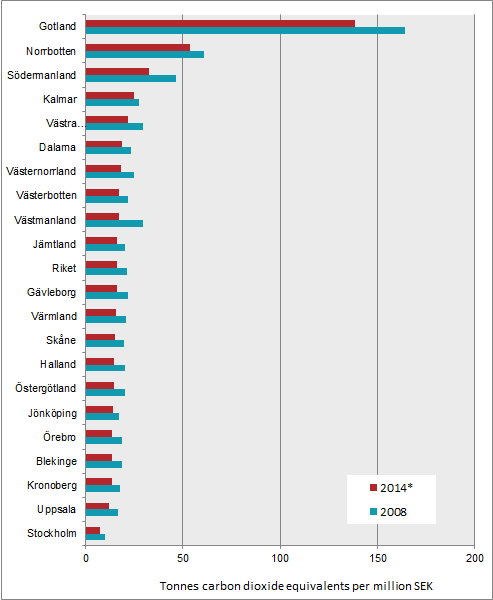
* 2014 Gross regional product is preliminary
Environmental economic profile by county in 2014
At a general level, a county’s environmental economic structure can be presented using an environmental economic profile.
In many counties, the proportion of emissions of greenhouse gases is about the same size as the proportion of employees and the proportion of the gross domestic product (GDP). Västra Götaland, Norrbotten, Södermanland, Gotland and Kalmar Counties have emission-intensive profiles with a larger proportion of greenhouse gas emissions than the proportion of employees and of the GDP. This is due to the location of emission-intensive industries and many shipping companies.
Västra Götaland has a high market production of both goods and services. This gives rise to a large proportion of employees, contributions to the GDP and emissions to air of greenhouse gases. Norrbotten has a small proportion of employees and of the GDP, but has a high proportion of greenhouse gas emissions. This is mainly due to low levels of employment in industries that have a large impact on emission levels.
Stockholm County has a large proportion of employees, and contributions to the GDP. The largest industries in Stockholm County are in the service industry and have relatively low emissions of greenhouse gases.
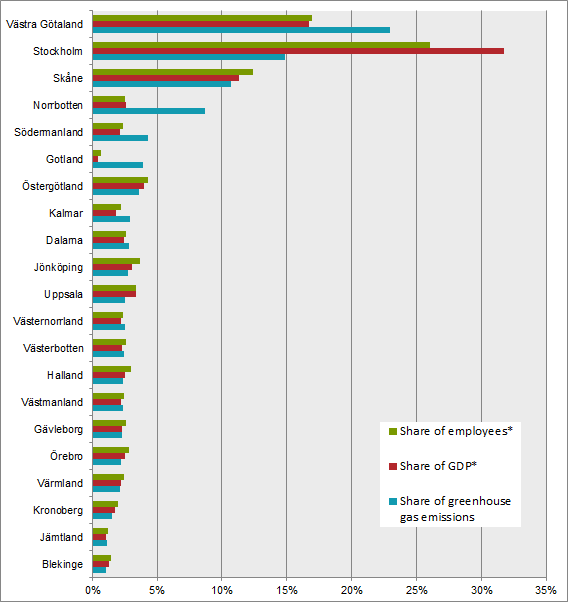
* 2014 Gross regional product and employed people figures are preliminary.
Since the 1990s,environmental accounts at Statistics Sweden has published annual statistics that link environmental issues to the economy.
Regional statistics in environmental accounts broken down by industry makes it possible to perform regional environmental economic analysis, for example using input-output analysis. Somewhat simplified it can be described like this: if demand increases by SEK 1 million – how much does production have to increase in all industries throughout the economy to meet this demand? What kind of emissions does it entail?
Definitions and explanations
The Environmental Accounts are compiled within the framework of the System of Environmental and Economic Accounts (SEEA) and show national environmental statistics and economic statistics in the same framework using NACE industry classification. Environmentally-related statistics connected to the system of national accounts enable an analysis between the Swedish economy and the impact that each industry has on the environment. Emissions from international bunkers, that is, international aviation and navigation arriving and refuelling at Swedish airports and harbours are included. Emissions and removals from land use and land use change (LULUCF) and carbon capture and storage (CCS) are not included.
Regional air emission accounts by NACE industries enables analyses of Swedish regions economy, its impact on the environment and the environments impact on the economy. It is possible to evaluate indicators such as specific industries’ streamlining of production processes based on emissions by value added.
Regional statistics on all greenhouse gases and a number of air pollutants are available in Sweden’s Statistical Database. Excel spreadsheets are also available for download on Statistics Sweden’s website, and include data and figures on greenhouse gas emissions and emissions intensities by value added and by employees.
The statistics on air emissions are based on a production perspective. Emissions are reported for the industry where emissions occur. Indirect emissions from imports and other consumption of goods and services are not included.
Regional statistics of emissions to air provided by the Swedish EPA refer to emissions within the territory, that is, emissions that occur within the boundaries of each region. As a result, if you want to, for example, study levels of air pollution in a specific area, Swedish EPA statistics should be used. See http://utslappisiffror.naturvardsverket.se/Alla-utslapp-till-luft/
Next publishing will be
The next statistical news about national quarterly emissions to air up to and including the third quarter of 2016 is scheduled for publication on 2017-01-31 at 09:30.
The next statistical news about national annual emissions to air 2008–2015 is scheduled for publication on 2017-03-29 at 09:30.
The next statistical news about regional annual emissions to air 2008–2015 is scheduled for publication on 2017-11-09 at 09:30.
Statistical Database
More information is available in the Statistical Database
Feel free to use the facts from this statistical news but remember to state Source: Statistics Sweden.