Environmental accounts – Emissions to air 2015, regional statistics:
Large regional differences of greenhouse gas emissions
Statistical news from Statistics Sweden 2017-11-09 9.30
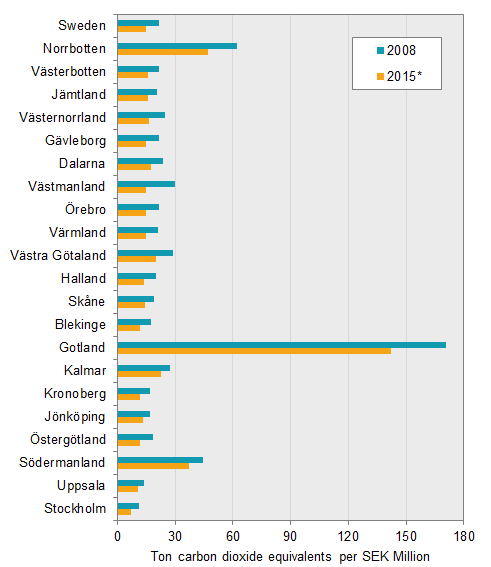
A reduction of greenhouse gas emissions in Sweden, in relation to GDP, also called the emission intensity, was recorded between 2008–2015. But there are large regional differences. The council of Gotland is the most emission intensive county in Sweden. The largest reduction of the emission intensity during the time period was recorded in Gotland and Västmanland.
The Environmental accounts at Statistics Sweden is today publishing regional emissions to air by industry and on regional- and municipality levels. Through the use of population-, employment- and economic statistics, new ways to present the statistics on emissions to air by putting them into relation to one another is possible. The combination enhances the relationships between population and air emissions and the contributions the companies make towards the economy but also to the pressure of the environment.
The statistics is presented in the form of emissions, emission intensities and environmental economic profiles. The statistics follow the framework of the national accounts and thus the link between the emissions and the economic activity shows who is responsible for the emissions. This does not necessarily mean that the emissions has actually taken place in the specific region, but that the responsible actor is located there.
Gotland is the most emission intensive council in Sweden. The main bulk of the emissions of greenhouse gases from their economy stem from the manufacture of goods for which there are large process emissions - but it is the service industry and public sector that provides the larges contributions to the economy in Gotland. Between 2008 and 2015 a reduction of the emission intensity of 17 per cent. However, the emission levels rose between 2014 and 2015.
* 2015 Gross regional product is preliminary
Environmental economic profile by council 2015
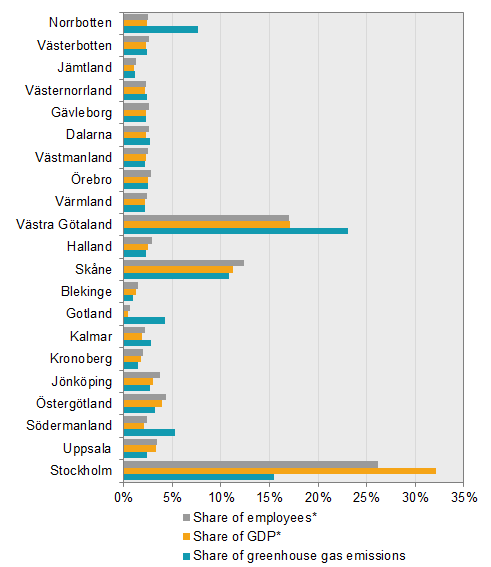
On a general level it is possible to present a structure of an environmental economic profile of a council. It will show e.g. the share of each council oin Sweden’s GDP.
For many councils, the share of emissions of greenhouse gases are about the same size as the share of employees and share of gross domestic product (GDP). Jämtland, Västernorrland, Gävleborg etc. Västra Götaland, NOrrbotten Södermanland and Gotland council has an emission intensive profile with a larger share of greenhouse gas emissions than shares of employees and GDP. This is due to the location of emission intensive industries and many shipping companies.
Västra Götaland has a high market production of both goods and services. This gives rise to a high share of employees, contributions to the GDP and emissions to air of greenhouse gases. Norrbotten has a smaller share employees and gross regional product but has a high share of greenhouse gas emissions. This is among other things mainly due to the low employment in industries that are causing high pressure on the emission levels.
The council in Stockholm has a high share of employment and contributions to the GDP. The most larges industries in Stockholm council are located within manufacture of services and has relatively low emissions to air of greenhouse gases.
* 2015 Gross domestic product and employees are preliminary data
Definitions and explanations
The Environmental Accounts are compiled within the framework of the System of Environmental and Economic Accounts (SEEA) and show national environmental statistics and economic statistics in the same framework using NACE industry classification. Environmentally-related statistics connected to the system of national accounts enable an analysis between the Swedish economy and the impact that each industry has on the environment. Emissions from international bunkers, that is, international aviation and navigation arriving and refuelling at Swedish airports and harbours are included. Emissions and removals from land use and land use change (LULUCF) and carbon capture and storage (CCS) are not included.
Regional air emission accounts by NACE industries enables analyses of Swedish regions economy, its impact on the environment and the environments impact on the economy. Indicators of for example different industries effectivisation of production processes are possible to evaluate by emissions by value added.
Regional statistics on all greenhouse gases and a number of air pollutants are available in Sweden’s Statistical Database. Excel spreadsheets are also available for download on Statistics Sweden’s website, and include data and figures on greenhouse gas emissions and emissions intensities by value added and by employees.
The regional breakdown is on county, municipality and NUTS levels. The NUTS classification is used for internationally comparable statistics.
The statistics on air emissions are based on a production perspective. Emissions are reported for the industry where emissions occur. Indirect emissions from imports and other consumption of goods and services are not included.
Regional statistics of emissions to air provided by the Swedish EPA refer to emissions within the territory, that is emissions that occur within the boundaries of each region. Because of this, if you want to for example study levels of air pollution in a specific area, the Swedish EPA statistics should be used.
Publication
Keep a lookout for Environmental Accounts report 2017:2 Regional environmental accounts 2008-2015where the statistics is explained in more detail. It will be published on November 22 2017.
Next publishing will be
The next Statistical News about national quarterly emissions to air up to and including the third quarter of 2017 is scheduled for publication on 2018-01-31 at 09:30.
The next Statistical News about national annual emissions to air 2008–2016 is scheduled for publication on 2018-03-27 at 09:30.
The next Statistical News about regional annual emissions to air 2008–2016 is scheduled for publication on 2018-11-15 at 09:30.
Statistical Database
More information is available in the Statistical Database
Feel free to use the facts from this statistical news but remember to state Source: Statistics Sweden.