Environmental Accounts – Emissions to air first quarter of 2019
Greenhouse gas emissions by the Swedish economy decreased in first quarter of 2019
Statistical news from Statistics Sweden 2019-08-29 9.30
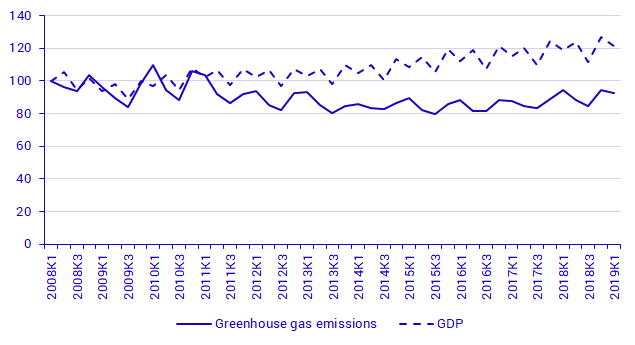
Greenhouse gas emissions by the Swedish economy decreased by 1.6 percent in the first quarter of 2019 compared with the same period in 2018. This decrease is mainly due to lower emissions by electricity, gas, and steam supply, as well as the transport industry. At the same time, GDP growth was 2.1 percent in the first quarter in 2019 compared with the same quarter in 2018.
New quarterly statistics from Environmental Accounts at Statistics Sweden measuring emissions by the Swedish economy and households are now available.
In the first quarter of 2019, greenhouse gas emissions by the Swedish economy and households amounted to 17 million tonnes of carbon dioxide equivalents. This is 1.6 percent less than in the same quarter in 2018. In the same period, Swedish GDP growth was 2.1 percent.
However, a change in methodology leads to some uncertainty regarding the emissions decrease for this quarter.
Source: Statistics Sweden
Uncertainties regarding emissions decrease in the transport industry
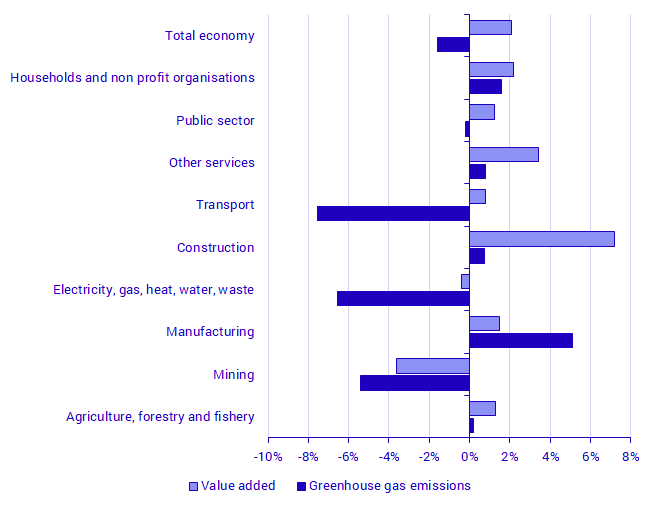
Declining greenhouse gas emissions in the first quarter 2019 were in part due to decreased emissions by electricity, gas, and steam industry, and the water and waste industry. Greenhouse gas emissions in these industries decreased by 6.6 percent compared with the same quarter in 2018. This is mainly due to decreased use of fossil fuels, such as natural gas, peat and coal.
The decreased greenhouse gas emissions in the first quarter of 2019 was also due to a change in fuel use in the transport industry, that is, aviation, shipping and trucking. Emissions decreased by 7.5 percent compared with the same quarter in the previous year. However, these results should be interpreted with caution, since monthly fuel, gas and inventory statistics, which are the basis for transport emissions, have been revised, which leads to uncertainties in the statistics. More information on the survey on monthly fuel, gas and inventory statistics is available here:
Monthly fuel, gas and inventory statistics
The decrease of total emissions of greenhouse gases by the Swedish economy and households in the first quarter of 2019 was hampered by higher emissions by the manufacturing industries. Emissions increased by 5.1 percent in the first quarter of 2019 compared with the same period in the previous year. This increase is mainly present in steel and metal production.
Source: Statistics Sweden
| NACE 2007 industry | Greenhouse gas emissions | Value Added | |||||
|---|---|---|---|---|---|---|---|
| 2019K1 | Change compared to same quarter 2018 | 2019Q1 | Change compared to same quarter 2018 | ||||
| Agriculture, forestry and fishery | 2 337 | 5 | 0.2% | 13 843 | 174 | 1.3% | |
| Mining | 307 | ‑18 | ‑5.4% | 7 377 | ‑278 | ‑3.6% | |
| Manufacturing | 4 073 | 198 | 5.1% | 176 436 | 2 603 | 1.5% | |
| Electricity, gas, heat, water, waste | 2 804 | ‑197 | ‑6.6% | 39 696 | ‑162 | ‑0.4% | |
| Construction | 507 | 4 | 0.8% | 69 747 | 4 667 | 7.2% | |
| Transport | 3 804 | ‑310 | ‑7.5% | 40 473 | 320 | 0.8% | |
| Other services | 861 | 7 | 0.8% | 487 648 | 16 215 | 3.4% | |
| Public sector | 169 | 0 | ‑0.2% | 231 309 | 2 864 | 1.3% | |
| Households and non-profit institutions [1] | 2 167 | 34 | 1.6% | 13 403 | 288 | 2.2% | |
| Total economy | 17 030 | ‑277 | ‑1.6% | 1 206 756 | 24 343 | 2.1% | |
[1] Only non-profit institutions provide value added.
Statistics from the Swedish Environmental Protection Agency
The Swedish Environmental Protection Agency also publishes statistics on emissions to air by quarter within Sweden’s territory, in which emissions from international transport is not included. The results show that greenhouse gas emissions in the first quarter 2019 remained relatively unchanged compared with the same quarter in 2018.
Revisions
The survey conducted by the Swedish Energy Agency on monthly fuel, gas and inventory statistics has been conducted for several years. The environmental accounts calculations for quarterly air emissions has used these statistics as input data to estimate emissions from mobile emissions. Since 2018, the Swedish Energy Agency has updated and developed the monthly energy statistics survey, which has resulted in some uncertainties. This led Environmental Accounts to choose a different method for a period. However, The publication of the statistical news in August 2019 saw a return to the earlier methodology of using statistics from monthly fuel, gas and inventory statistics to estimate emissions by mobile combustion 2018Q1–2019Q1.
Currently, several activities are underway to improve the statistics, and revisions of monthly fuel, gas and inventory statistics are expected in 2019. This will also lead to revisions of the emissions statistics 2018Q1–2019Q1. All in all, this uncertainty affects mobile combustion, which accounts for about 45 percent of greenhouse gas emissions. For this reason, there is also a break in the time series in the yearly data between 2018 and 2017.
More information (in Swedish) on the revisions is available on the Environmental Accounts’ product page under Documentation.
Definitions and explanations
Frequently asked questions – climate change statistics
Statistics Sweden and the Swedish Environmental Protection Agency are now publishing statistics on emissions to air and climate in the first quarter of 2019.
The statistics presented by Statistics Sweden and the Swedish Environmental Protection Agency differ from each other. Some simple questions and answers follow below about why they are different and what the statistics can be used for.
What are the statistics about?
These statistics cover emissions of greenhouse gases and air pollution.
The Swedish Environmental Protection Agency are responsible for the statistics from the territory of Sweden, also called territorial statistics and Statistics Sweden is responsible for the statistics on emissions by the economy, as a part of the System of Environmental Economic Accounting. Both of these statistical products are classified as official statistics, which means that they follow guidelines on when and how the statistics are to be published, how the quality is to be assured and the documentation design.
Are there differences in the statistics – and if so, why?
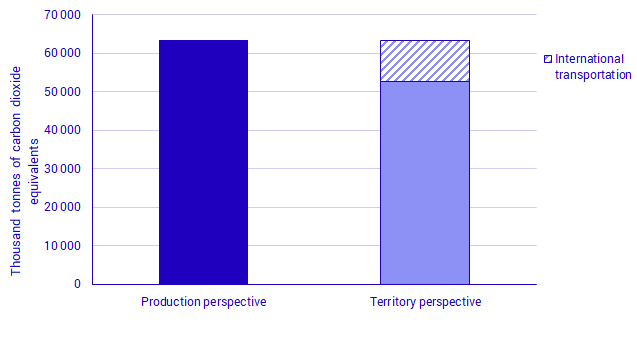
The System of Environmental Economic Accounting is constructed using the national accounts as a base and present environmental and economic statistics in a common system. The point of departure is Swedish economic actors, independent of where in the world their environmental impact occurs. As the focus lay on the economic actors that are included, activities such as international transport are included in the same way that they are included in economic statistics. As such, these results show typically larger emission levels than the territorial emissions.
The territorial statistics on greenhouse gas emissions show territorial emissions, that is, the emissions that occurred within Sweden’s borders.
This often leads to different levels in these two statistical products (see an example from 2017 below). Sometimes the changes between years can also differ.
Comparison of Environmental Accounts data on total production-based emissions and Swedish EPA data on total territory-based emissions, 2017
Source: Statistics Sweden, Environmental Accounts and the Swedish Environmental Protection Agency
Are the differences significant for how the statistics can be used?
Yes, they are significant. Territorial statistics looks at the amount of emissions of climate change gases released within Sweden’s borders and are used to monitor the development of emissions in comparison with defined climate change targets in Sweden, the EU and the UN.
The climate change statistics that are reported to the UN are constructed to present which emission sources are present in the different countries. Here, it may be expected that these countries have a large impact on the laws and regulations that apply and are be able to make calculations on the reduction targets for that country.
The statistics that are produced within the environmental accounts can instead answer the question on which parts of production and consumption contribute to the emissions. It is also possible to make analyses by linking the statistics to industries and products to look at prices on natural resources and addressing other questions, such as the impact of employment.
Why are two different government agencies producing almost identical statistics?
In Sweden, the Government has appointed 28 government agencies to be responsible for official statistics within their respective areas. Within the area of environment, four government agencies are responsible for official statistics. The Swedish EPA is responsible for official statistics on emissions, waste, implementation of the Environmnental Code and the state of the environment. In the same field, Statistics Sweden is responsible for official statistics in environmental accounts, which is based on the economic statistics that Statistics Sweden is also responsible for and sustainable development, that connects statistics from a range of areas, land use, water use, and fertilisers and lime.
Why are there two different statistical frameworks on emissions to air and climate?
The two different statistical standards for emissions to air and climate answer different questions. Questions about how the economy effects the environment needs to be answered using other system boundaries than questions about what happens with the environmental impact within a country. The frameworks have been developed by experts who have ensured that the statistics that are produced are globally comparable for the specific purpose they serve. All countries that produce this type of statistics must follow the dedicated framework and do their best to ensure that the same activities are included in the statistics for comparability.
For international reporting to the climate change convention, the guidelines have been developed by the UN panel on climate change: https://www.ipcc.ch/.
For environmental accounts, a statistical standard is available, developed by the UN Statistical Division. www.seea.un.org/content/seea-central-framework.
Both types of statistical products are reported at the international level, to the UN, to Eurostat, and to the European Environment Agency, through regulations and conventions.
What are the government agencies doing to cooperate?
The two government agencies develop common documents that describe the statistics to create a consensus on what we do. We also take part together in conferences and in other platforms to inform about the work we do. Please listen to the podcast at Statistics Sweden, in which we discuss climate change statistics together (in Swedish): På tal om siffror - Miljö och klimat.
The largest cooperation by far is conducted through the Swedish consortium SMED (Swedish Environmental Emissions Data), in which Statistics Sweden is a partner and the Swedish EPA is the commissioner. SMED produces the annual and the quarterly statistics to the Swedish EPA for the territorial statistics. The commission for the quarterly statistics is carried out in close cooperation with the team for environmental accounts that has developed an effective production system for producing quarterly statistics for both the economy and the territory of Sweden. This work includes an exchange of data and knowledge between the agencies.
Are you interested in finding out more about the differences in the statistics, read more here (in Swedish):
About the territorial statistics:
Kvartals- och preliminära årsvisa växthusgasutsläpp
About the environmental accounts calculations for emissions to air and climate change:
Kvalitetsdeklaration: Miljöräkenskaperna – Utsläpp till luft per kvartal, 2008-2018 (pdf)
A joint description of the statistics:
Next publishing will be
The next statistical news, on quarterly emissions to air in the second quarter 2019, is scheduled for publication on 2019-10-24 at 09.30.
Statistical Database
More information is available in the Statistical Database
Feel free to use the facts from this statistical news but remember to state Source: Statistics Sweden.