Environmental accounts – Emissions to air Q3 2017:
Trade and industry’s greenhouse gas emissions increased
Statistical news from Statistics Sweden 2018-01-31 9.30
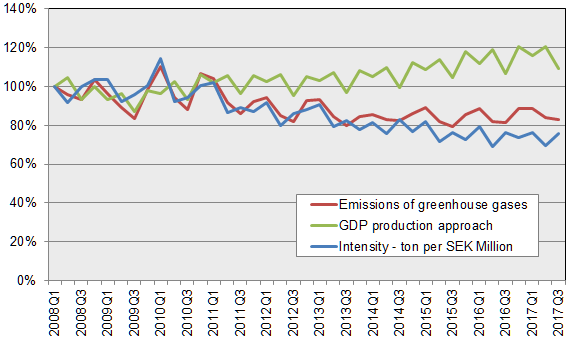
Greenhouse gas emissions by the Swedish economy increased in the third quarter of 2017 compared with the same quarter 2016. This increase was mainly caused by higher emissions by enterprises in electricity, gas and heating, and waste managment. Emissions by households’ passenger cars and heating dropped.
In the third quarter of 2017, greenhouse gas emissions by the Swedish economy amounted to 15.3 million tonnes of carbon dioxide equivalents, up 1.8 percent from the same quarter in 2016. In same period, economic growth was 2.5 percent according to new statistics from the Enviornmental accounts at Statistics Sweden, which measure emissions by Swedish economic actors, including households.
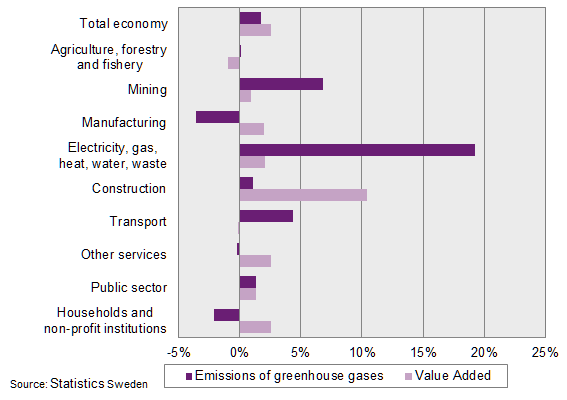
There are several driving forces behind the increased emissions in the third quarter of 2017. The most important reason is that emissions in electricity, gas, heating, water and waste management increased by 19 percent. Emissions by mining and quarrying are also rising, up nearly 7 percent from the same quarter in 2016.
Emissions by manufacturing industries fell by almost 4 percent. Food production, refineries and chemicals production industries account for this decrease. Value added, that is, the economic development, is decreasing in these industries.
Household emissions, mainly by passenger cars, dropped by 2 percent in the third quarter of 2017 relative to the same quarter in 2016. This continued decrease of emissions by households is due to achange in the use of fuel types. The use of fossil-based fuels is decreasing, while the use of biofuels is continuing to increase.
Economic growth in the third quarter of 2017 varied in different industries. Value added increased most in motor vehicle manufacture, but construction, other machine manufacture and manufacture of electrical equipment also increased clearly. The largest decrease in value added was in refining and chemicals, and health and social care.
The National Accounts explain GDP growth on the demand side by increased fixed gross investments, and also by increased exports.
Source: Statistics Sweden, Environmental accounts and national accounts
Source: Statistics Sweden, Environmental accounts and national accounts
Revisions
Since the previous publication on 2017-10-26, the following revisions have been made for quarters from 2008Q1 to 2017Q3:
- New yearly energy balances have been published and incorporated. This new data led to minor changes in forestry industry and in industries with fewer than 10 employees.
More information (in Swedish) on the revisions is available at the Environmental Accounts’ product page under Documentation.
Developments in different industries
The connection between emissions of greenhouse gases and industry’s contribution to the Swedish economy varies between industries, due to the different types of activities in each industry. Some industries are emissions-intensive, and increased production means higher emissions, while other industries may increase value added without any significant increase in emissions levels.
| Industry (NACE) | Emissions of greenhouse gases | Value added | |||||
|---|---|---|---|---|---|---|---|
| 2017Q3 | Change compared to same quarter 2016 | 2017Q3 | Change compared to same quarter 2016 | ||||
| Agriculture, forestry and fishing | 2 236 | 2 | 0.1% | 12 077 | ‑111 | ‑0.9% | |
| Mining | 357 | 23 | 6.8% | 3 750 | 34 | 0.9% | |
| Manufacturing | 3 423 | ‑126 | ‑3.6% | 144 665 | 2 848 | 2.0% | |
| Electricity, gas, heat, water, waste | 1 607 | 259 | 19.2% | 22 396 | 454 | 2.1% | |
| Construction | 479 | 5 | 1.1% | 58 760 | 5 544 | 10.4% | |
| Transport | 3 725 | 154 | 4.3% | 40 707 | ‑45 | ‑0.1% | |
| Other services | 833 | ‑2 | ‑0.2% | 468 751 | 11 882 | 2.6% | |
| Public sector | 185 | 2 | 1.3% | 166 488 | 2 196 | 1.3% | |
| Households and non-profit institutions [1] | 2 441 | ‑53 | ‑2.1% | 12 663 | 149 | 1.2% | |
| Total economy | 15 286 | 265 | 1.8% | 930 257 | 22 951 | 2.5% | |
[1] Only non-profit institutions provide value added.
Agriculture, forestry and fishing
Agriculture, forestry and fishing accounted for 15 percent of total greenhouse gas emissions in the Swedish economy. Most greenhouse gases emitted in this sector (around 90 percent) come from agriculture. Greenhouse gas emissions remained largely unchanged in the third quarter compared with the same quarter of 2016. This industry group accounts for about 1 percent of value added, in which the forestry industry accounts for about 70 percent. Value added in the whole industry decreased by about 1 percent in the third quarter of 2017 compared with the same quarter of 2016.
Mining
Emissions by mining account for 2 percent of all emissions in the Swedish economy. Emissions increased by nearly 7 percent in the third quarter compared with the same quarter of 2016. This industry’s value added accounts for 0.4 percent of the GDP. Value added increased by nearly 1 percent in the third quarter of 2017compared with the same quarter of 2016.
Manufacturing
Manufacturing accounts for about 22 percent of total greenhouse gas emissions in the Swedish economy. Industries that contribute the most to greenhouse gas emissions are steel, metal, chemicals production, refineries and cement production. Greenhouse gas emissions decreased by 3.6 percent in the third quarter of 2017 compared with the same quarter of 2016. In the period, value added increased by 2 percent. The most significant decrease in emissions was in refineries and chemicals manufacture, and food production, due to decreased production.
Electricity, gas, heat, water and waste
Greenhouse gas emissions in this sector annually account for 10 percent of total greenhouse gas emissions by the Swedish economy. Most greenhouse gas emissions (65 to 85 percent each quarter) come from electricity and heat production. Emissions levels in the third quarter of 2017 were 19 percent higher than in the same quarter of 2016, and value added increased by 2 percent.
Construction
Model-estimated greenhouse gas emissions in this industry account for 3 percent of total greenhouse gas emissions in the Swedish economy and households. Emissions arise mainly in transport, machinery and industrial vehicles. In the third quarter of 2017, emissions increased by 1 percent, while value added increased by 10 percent compared with the same period in 2016.
Transport
Greenhouse gas emissions in the transport industry account for 23 percent of total emissions in the Swedish economy. Emissions increased by 4 percent in the third quarter in 2017 compared with the same quarter in 2016. Emissions arose mainly in maritime traffic, although the increase in the second quarter is from both aviation, maritime traffic and land transport. Value added remained largely unchanged in the third quarter of 2017 compared with the same quarter of 2016.
Other services
Greenhouse gas emissions in other services account for 5 percent of total emissions in the Swedish economy. Emissions in these industries are relatively small compared with value added and are mainly due to road transports. In the third quarter of 2017, emissions remained largely unchanged, while value added increased by 3 percent compared with the same quarter in 2016.
Public sector
Greenhouse gas emissions in the public sector (central government, county and municipality) account for about 1 percent of total emissions in the Swedish economy. Emissions arise mainly in working machinery, road transports and military activities. Emissions increased by 1 percent in the third quarter of 2017 compared with the same quarter in 2016. Value added also increased by 1 percent in the same period.
Households and non-profit institutions
Greenhouse gas emissions by households and non-profit institutions account for 15 percent of total emissions in the Swedish economy. Emissions arise mainly in households’ passenger car transport. Changes in fuel use have an important impact on emissions. The use of fossil fuels, which still accounts for the majority of the fuels used, is decreasing. Taken together, this results in decreased emissions by 2 percent in the third quarter of 2017, compared with the same quarter in 2016. Only non-profit institutions contribute to the GDP through their value added, which increased by 1 percent compared with the third quarter of 2016.
Definitions and explanations
The Environmental Accounts are compiled within the framework of the System of Environmental and Economic Accounts (SEEA) and present national environmental statistics and economic statistics in the same framework, using NACE industry classification. Environmentally-related statistics connected to the system of national accounts enable an analysis of the Swedish economy and the impact that each industry has on the environment.
Emissions to air according environmental accounts is based on a production perspective and defined by the nationality of economic actors. Direct emissions from Swedish economic actors are included, regardless of where in the world emissions occur. This is called the residence principle and includes three parts:
- Emissions within the Swedish territory
- Deduct emissions from aviation, navigation and land transport from foreign economic actors in Sweden
- Add emissions from aviation, navigation and land transport from Swedish economic actors abroad
As an approximation, the environmental accounts residence adjustment currently includes emissions from international bunkers, that is, international aviation and navigation arriving and refuelling at Swedish airports and harbours. A simplified assumption is thus made that emissions from foreign land transports in Sweden are equal to emissions from Swedish land transports abroad and that emissions related to what Swedish ships and planes bunker abroad are equal to emissions related to what foreign ships and planes bunker in Sweden.
Indirect emissions from imports and other consumption of goods and services are not included. Emissions and removals from land use and land use change (LULUCF) and carbon capture and storage (CCS) are not included.
Annual Environmental Accounts on emissions to air by industry currently has a production time of 15 months. There is a demand for more up-to-date statistics on emissions to air of greenhouse gases. To meet this need, Environmental Accounts at Statistics Sweden has developed quarterly statistics on emissions to air by industry that was also used to produce preliminary annual statistics. These quarterly statistics are also used to produce preliminary data for T-1, and this data is delivered to Euorstat.
Quarterly statistics on all greenhouse gases and a number of air pollutants are available in Sweden’s Statistical Database. Excel spreadsheets are also available for download on Statistics Sweden’s website, and include data and figures on greenhouse gas emissions and emissions intensities by value added and by employee.
The SEEA analytical web tool contains the collective statistics concerning this area, from production to demand, including statistics on environmental economic steering instruments, economic development and environmental pressure from production and final demand.
Next publishing will be
The next statistical news on annual emissions to air 2008–2016 (final statistics) is scheduled for publication on 2018-03-27 at 09.30.
The next statistical news on quarterly emissions to air up to and including the fourth quarter of 2017 is scheduled for publication on 2018-05-08 at 09:30.
Statistical Database
More information is available in the Statistical Database
Feel free to use the facts from this statistical news but remember to state Source: Statistics Sweden.