Environmental Accounts – Emissions to air second quarter 2025
Greenhouse gas emissions from Sweden’s economy decreased in the second quarter of 2025
Statistical news from Statistics Sweden 2025-10-23 8.00
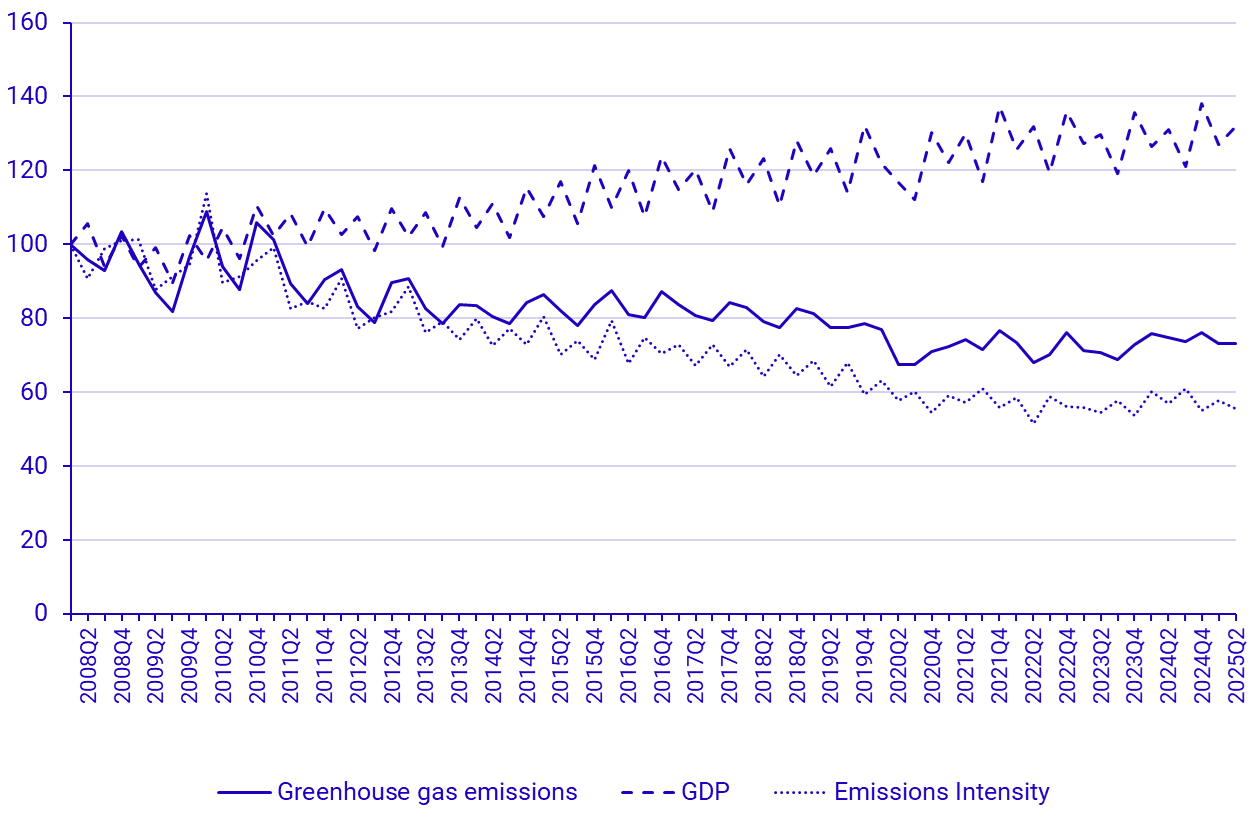
Greenhouse gas emissions from the Swedish economy amounted to 12.6 million tonnes in the second quarter of 2025, according to preliminary statistics from Statistics Sweden. This represents a 2.1 percent decrease compared to the same quarter in 2024. During the same period, GDP at constant prices increased by 0.9%, resulting in a 3.0% reduction in emissions intensity. From a longer-term perspective, greenhouse gas emissions have increased by 3.7 percent compared to the second quarter of 2023.
Quarterly statistics from Statistics Sweden’s environmental accounts, report preliminary air emissions from Sweden’s economy, including households. The greenhouse gas emissions are presented as the sum of individual gases measured in carbon dioxide equivalents.
A key factor behind the reduced emissions is the decline in deliveries of fossil diesel during the second quarter of 2025 compared with the same period in 2024. This is based on Statistics Sweden’s statistics on fuel deliveries to the Swedish market (Monthly Fuel, Gas, and Stock Statistics).
Preliminary emissions from households and non-profit organisations decreased by 84 kilotonnes of CO₂ equivalents (-4.0%). The Electricity, gas and heating production as well as water, sewage and waste treatment and management sector saw a reduction of 55 kilotonnes (-3.6%). Emissions from the manufacturing industry remained unchanged, while emissions from mineral extraction increased by 13 kilotonnes (6.4%).
Summary of developments in Q2 2025
Percentages below compare each sector with the same quarter of the previous year, unless otherwise stated.
- The largest absolute reduction was seen in households and non-profit organisations, with emissions falling by 84 kilotonnes, equivalent to 4.0 per cent.
- A significant decrease was also observed in the Electricity, gas and heating production as well as water, sewage and waste treatment and management sector (SNI D35–E39), down 55 kilotonnes (-3.6 per cent). This marks the lowest second-quarter emissions for the sector since 2019.
- The manufacturing industry (SNI C10–C33) recorded unchanged emissions. However, when comparing the first two quarters of 2025 with the same period in 2024, there is a slight decline of 1 per cent.
| NACE 2007 industry | Greenhouse gas emissions | Value added | ||||
|---|---|---|---|---|---|---|
| 2025 Q2[1] |
Change compared to 2024 Q2 |
2025 Q2[1] |
Change compared to 2024 Q2 |
|||
| Agriculture, forestry and fishery | 2 033 | ‑29 | ‑1.4% | 21 468 | ‑1 420 | ‑6.2% |
| Mining | 221 | 13 | 6.4% | 9 302 | 896 | 10.7% |
| Manufacturing | 3 459 | 11 | 0.3% | 211 238 | ‑457 | ‑0.2% |
| Electricity, gas, heat, water, waste | 1 489 | ‑55 | ‑3.6% | 36 300 | ‑1 103 | ‑2.9% |
| Construction | 508 | ‑35 | ‑6.5% | 86 506 | ‑4 794 | ‑5.3% |
| Transport | 2 017 | ‑45 | ‑2.2% | 49 922 | ‑2 704 | ‑5.1% |
| Other services | 791 | ‑41 | ‑5.0% | 719 215 | 24 498 | 3.5% |
| Public sector | 83 | ‑3 | ‑4.0% | 300 989 | ‑4 820 | ‑1.6% |
| Households and non-profit institutions [2] | 2 003 | ‑84 | ‑4.0% | 19 163 | 467 | 2.5% |
| Total economy [3] | 12 604 | ‑269 | ‑2.1% | 1 631 132 | 14 799 | 0.9% |
[1] Greenhouse gas emissions and value added are preliminary. [2] Only non-profit institutions provide value added. [3] The total refers to GDP at market prices, including product taxes and subsidies. The subtotals do not sum up to the total. Source: Statistics Sweden
![Graph: Change in greenhouse gas emissions and value added, change in percentage between 2024 Q2 and 2025 Q2[1].](/contentassets/62245a9aa01e4a2d9ea1fcb455731dbc/dia2_en_press_2025k02_.png)
[1] Greenhouse gas emissions and value added are preliminary. [2] Only non-profit institutions provide value added.
Definitions and explanations
What do the quarterly statistics show?
The quarterly statistics from Statistics Sweden's environmental accounts report production-based emissions to air per industry from the Swedish economy, which also includes households. Production-based emissions are emissions of greenhouse gases by Swedish economic actors and differ from the territorial emissions, which instead include emissions within the national borders. The territorial emissions are used in the UN, EU and nationally to follow up climate targets. The production-based emission statistics include the emissions from Swedish companies and individuals that occur both outside and inside Sweden's borders. Production-based emissions use the same system boundary as the national economic statistics, i.e., the national accounts.
For the transport industry, emissions arising from transport companies with economic residence in Sweden are included, regardless of where in the world these emissions occur. Emissions from, e.g., foreign airlines flying to, from or within Sweden are not included.
When comparing quarters, the reader should be attentive to seasonal variation. For example, emissions from electricity, gas, heat, water, waste are higher during the winter whereas households’ consumption of diesel and petrol are higher during the summer.
Greenhouse gas emissions – carbon dioxide equivalents are calculated as an aggregate of CO2 (fossil), CH4, N2O, HFC, PFC, SF6. The conversion factors (Greenhouse Warming Potential, GWP) used to calculate carbon dioxide equivalents are the same as those used for reporting to UNFCCC [1].
[1] IPCC, 2014: Climate Change 2014: Synthesis Report. Contribution of Working Groups I, II and III to the Fifth Assessment Report of the Intergovernmental Panel on Climate Change [Core Writing Team, R.K. Pachauri and L.A. Meyer (eds.)]. IPCC, Geneva, Switzerland, 151 pp, AR5 Synthesis Report - Climate Change 2014 (ipcc.ch)
More information about emission accounts is available on the Statistics Sweden’s website Miljöräkenskaper (scb.se) under the heading (in Swedish): Dokumentation
Revisions
Updates to the energy data forming the basis of emissions calculations have been made in certain sectors for the period Q1 2024 to Q2 2025. Emissions of sulphur oxides (SOx) and nitrogen oxides (NOx) have been corrected across the entire time series compared with the previous publication. Regarding emissions from air traffic, the OECD has not updated the statistics used to estimate these emissions. While awaiting the resumption of publication, data from the most recently available statistics have been used, referring to Q4 2024.
Next publishing will be
The next release of quarterly emissions to air will be published on January 29, 2026, covering the third quarter of 2025.
Statistical Database
More information is available in the Statistical Database
Feel free to use the facts from this statistical news but remember to state Source: Statistics Sweden.