Environmental Accounts – Emissions to air third quarter of 2018
Greenhouse gas emissions remain unchanged in the third quarter of 2018
Statistical news from Statistics Sweden 2019-01-31 9.30
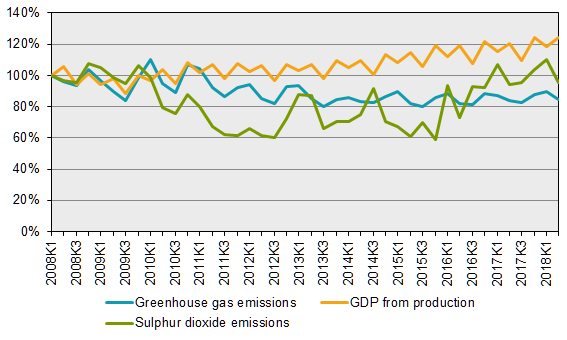
Greenhouse gas emissions by the Swedish economy remained largely unchanged in the third quarter of 2018, with a decrease of 0.7 percent compared with the same quarter in 2017. The only major change in emissions was seen in the electricity, gas and heating industry, with a decrease of 6 percent, or 92 thousand tonnes of greenhouse gases. The Swedish economy grew by 1.6 percent in the third quarter of 2018.
New quarterly statistics from the Environmental Accounts at Statistics Sweden measuring emissions from the Swedish economic actors and households are now available. In the third quarter of 2018, greenhouse gas emissions by the Swedish economy and households amounted to 15 million tonnes of carbon dioxide equivalents. This is 0.7 percent less than in the same quarter in 2017. In the same period, economic growth was 1.6 percent.
The Environmental Accounts publishes statistics on 15 different types of air emissions by industry and per quarter. One such pollutant is particles. These stem from combustion and wear and tear from tyres. The particles are normally measured by size, either 10 or 2.5 micrometer. Inhaling particles may have negative effects on your health and can cause heart and lung diseases.
Emissions of particles show clear seasonal trends, and the fourth quarter each year shows a spike in that trend. Households and the transport industry account for the highest contribution to these emissions, together accounting for 65 percent of total emissions.

Source: Statistics Sweden, Environmental Accounts and National Accounts.
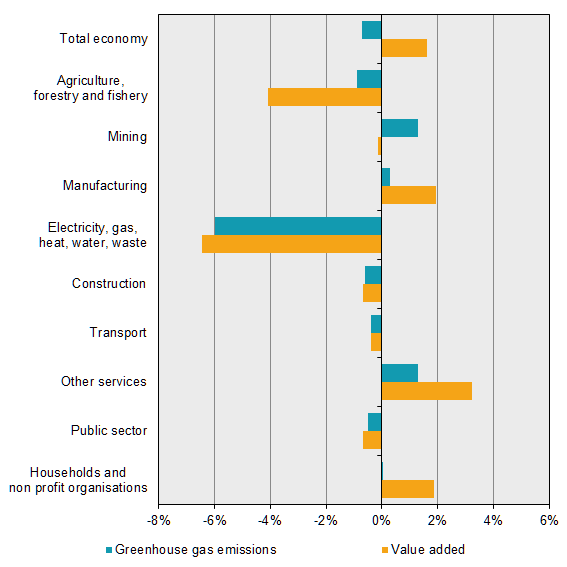
Greenhouse gas emissions by the manufacturing industry remained unchanged in the third quarter of 2018 compared with the same period in 2017. At the same time, value added in the manufacturing industry increased by 1.9 percent.
Greenhouse gas emissions by the electricity, gas, heating, water and waste industries decreased by 6 percent in the third quarter of 2018 compared with the same quarter in 2017. Most greenhouse gas emissions come from electricity and heat production. Both emissions and value added in this industry vary seasonally and are often higher in the first and last quarter. The lower greenhouse gas emissions in the third quarter of 2018 are due to lower use of fossil fuels such as natural gas, peat and coal as a result of the warm summer.

Source: Statistics Sweden, Environmental Accounts and National Accounts. Note: Only non-profit organisations, and not households, provide value added.
Developments in different industries
The connection between greenhouse gas emissions and industries’ contribution to the Swedish economy vary between industries. Some industries are emissions-intensive, and increased production means higher emissions, while other industries may increase value added without any significant increase in emissions levels.
| NACE 2007 industry | Greenhouse gas emissions | Value Added | |||||
|---|---|---|---|---|---|---|---|
| 2018Q3 | Change compared to same quarter 2017 | 2018Q3 | Change compared to same quarter 2017 | ||||
|
Agriculture, forestry and fishery
|
2 262 | ‑21 | ‑0.9% | 11 234 | ‑479 | ‑4.1% | |
|
Mining
|
458 | 6 | 1.3% | 4 369 | ‑6 | ‑0.1% | |
|
Manufacturing
|
3 283 | 11 | 0.3% | 148 141 | 2 827 | 1.9% | |
|
Electricity, gas, heat, water, waste
|
1 435 | ‑92 | ‑6.0% | 22 064 | ‑1 519 | ‑6.4% | |
|
Construction
|
484 | ‑3 | ‑0.6% | 59 404 | ‑401 | ‑0.7% | |
|
Transport
|
3 653 | ‑14 | ‑0.4% | 42 450 | ‑162 | ‑0.4% | |
|
Other services
|
826 | 11 | 1.3% | 484 096 | 15 176 | 3.2% | |
|
Public sector
|
173 | ‑1 | ‑0.5% | 172 467 | ‑1 180 | ‑0.7% | |
|
Households and non-profit institutions [1]
|
2 423 | 0 | 0.0% | 13 198 | 243 | 1.9% | |
|
Total economy
|
14 999 | ‑103 | ‑0.7% | 1 087 517 | 17 036 | 1.6% | |
[1] Only non-profit organisations, and not households, provide value added.
Revisions
Since the previous publication on 25 October 2018, the following revisions have been made:
- Minor revisions due to updated emission factors affects all stationary combustions for the whole time series.
- New statistics in the form of updated yearly energy balances affects stationary combustion in industries in NACE 01-05, NACE 36-99, private and public consumption.
More information (in Swedish) on the revisions is available on the Environmental Accounts’ product page under Documentation.
Definitions and explanations
The Environmental Accounts are compiled within the framework of the System of Environmental and Economic Accounts (SEEA) and present national environmental statistics and economic statistics in the same framework, using NACE industry classification. Environmentally-related statistics connected with the system of national accounts enable analysis of the Swedish economy and the impact of each industry on the environment.
Emissions to air according to the environmental accounts is based on a production perspective and defined by the nationality of economic actors. Direct emissions from Swedish economic actors are included, regardless of where in the world emissions occur. This is called the residence principle and includes three parts:
- Emissions within the Swedish territory
- Deductions of emissions by aviation, navigation and land transport from foreign economic actors in Sweden, and
- Addition of emissions by aviation, navigation and land transport from Swedish economic actors abroad
As an approximation, the environmental accounts residence adjustment currently includes emissions from international bunkers, that is, international aviation and navigation arriving and refuelling at Swedish airports and harbours. A simplified assumption is thus made that emissions resulting from foreign land transports in Sweden are equal to emissions resulting from Swedish land transports abroad and that emissions related to what Swedish ships and planes bunker abroad are equal to emissions related to what foreign ships and planes bunker in Sweden.
Indirect emissions resulting from imports and other consumption of goods and services are not included. Emissions and removals resulting from land use and land use change (LULUCF) and carbon capture and storage (CCS) are not included.
Annual Environmental Accounts on emissions to air by industry currently has a production time of 15 months. There is a demand for more up-to-date statistics on emissions to air of greenhouse gases. To meet this need, Environmental Accounts at Statistics Sweden has developed quarterly statistics on emissions to air by industry, which are also used to produce preliminary annual statistics. These quarterly statistics are also used to produce preliminary data for T-1, and this data is delivered to Eurostat.
Quarterly statistics on all greenhouse gases and a number of air pollutants are available in Sweden’s Statistical Database. Excel spreadsheets are also available for download on Statistics Sweden’s website and include data and figures on greenhouse gas emissions and emissions intensities by value added and per employee.
The SEEA analytical web tool contains the collected statistics about this area – from production to demand – including statistics on environmental economic steering instruments, economic development and environmental pressure from production and final demand.
Next publishing will be
The next statistical news, on quarterly emissions to air for the fourth quarter 2018, is scheduled for publication on May 9 2019.
Statistical Database
More information is available in the Statistical Database
Feel free to use the facts from this statistical news but remember to state Source: Statistics Sweden.
