Environmental accounts – environmental pressure from consumption 2020
Greenhouse gas emissions from Swedish consumption decreased in 2020
Statistical news from Statistics Sweden 2022-09-29 8.00
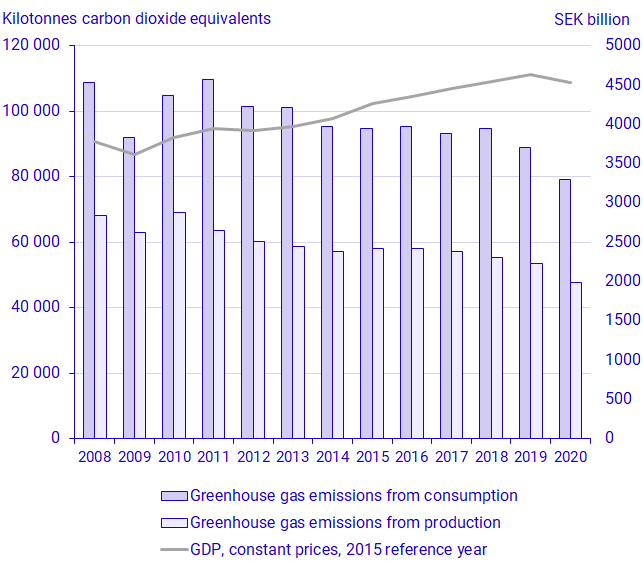
In 2020 greenhouse gas emissions from Swedish consumption were 7.6 tonnes of carbon dioxide equivalents. This is a decrease of 12 percent compared to 2019, and a decrease of 35 percent compared to 2008.
Sweden’s consumption-based greenhouse gas emissions (from households, the public sector and investments, but excluding export) were 79 million tonnes of carbon dioxide equivalents (7.6 tonnes per capita) in 2020. This is a decrease from 98 million tonnes of carbon dioxide equivalents (8.7 tonnes per capita) in 2019 and a decrease from 109 million tonnes of carbon dioxide equivalents (12 tonnes per capita) in 2008. The decreasing trend depends both on decreased emissions from Swedish production and decreased emissions embodied in products imported by Sweden. For this publication, methodological revisions have been applied in the entire time series from 2008 to 2020 (see also revisions below).
Source: Statistics Sweden
Household consumption and export are significant for emissions sources
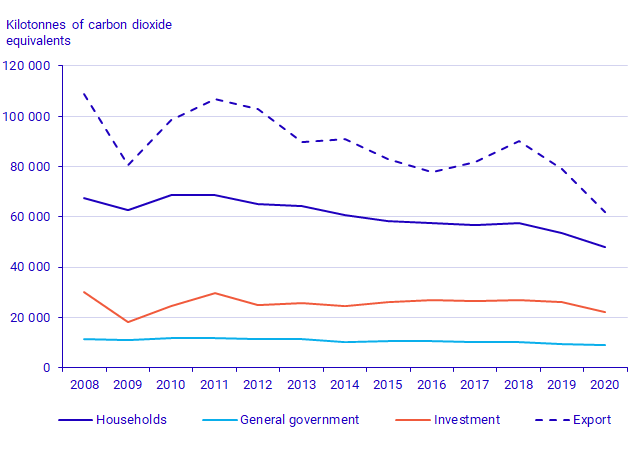
Greenhouse gas emission from household consumption were 48 million tonnes of carbon dioxide equivalents in 2020. Compared with 2008 this is decrease of 29 percent. Compared with 2019 this is a decrease of 10 percent.
Sweden’s export are also a significant source of greenhouse gas emissions, though they are not included in Sweden’s consumption-based emissions (which cover domestic final demand). Emissions from Sweden’s exports decreased by 22 percent in 2020 compared with 2019.
Source: Statistics Sweden Note: Households include non-profit institutions serving households
Household’s transport emissions decreased in 2020
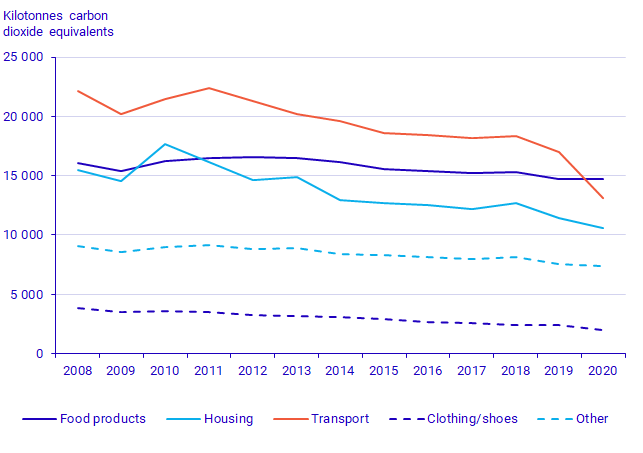
Greenhouse gas emissions from household consumption decreased by 10 percent between 2019 and 2020 from 53 to 48 million tonnes of carbon dioxide equivalents. The largest decrease was in transport, which decreased by 23 percent between 2019 and 2020 from 16.9 to 13.1 million tonnes of carbon dioxide equivalents. The decrease can be related to decreased travel (in particular air travel) due to the Covid-19 pandemic. Emissions also decreased between 2019 and 2020 for dwellings, clothing and shoes and others, but were unchanged for food.
Source: Statistics Sweden
Production in Sweden and Europe most significant for greenhouse gas emissions from Swedish consumption
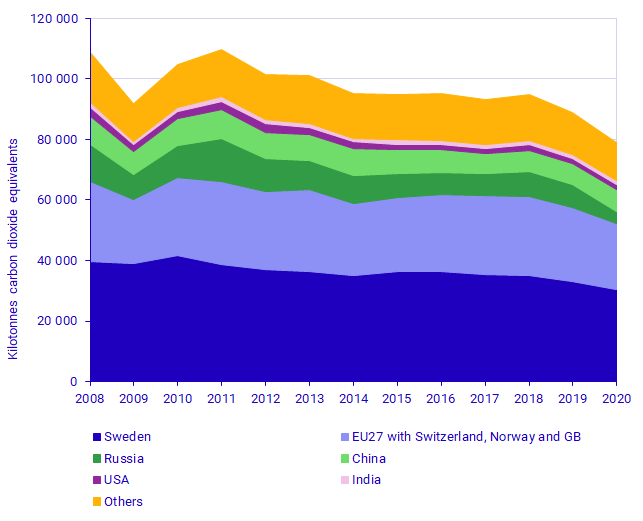
In 2020, 38 percent of greenhouse gas emissions embodied in Swedish consumption came from production in Sweden. At the same time 28 percent of greenhouse gas emissions embodied in Swedish consumption came from production in the EU-27 (plus Norway, Switzerland and the United Kingdom).
Greenhouse gas emissions embodied in Swedish consumption arising in Russian production decreased by over 45 percent between 2019 and 2020, from 7.5 to 4.1 million tonnes of carbon dioxide emissions. Over the same time interval, Sweden’s import of fossil fuels from Russia decreased by 80 percent in monetary terms according to Statistics Sweden’s statistics on Sweden’s foreign trade in goods.
Revisions
For this publication, revisions have been implemented in source data used in statistics production. This leads to time series differences compared to earlier publications of this statistics product.
Revisions in the National Accounts
For each yearly publication, revisions are made to the entire time series for the National Accounts statistics on production, intermediate use, final demand and foreign trade in Sweden’s economy. More information about the revisions can be found here (in Swedish):
Kvalitetsdeklaration Nationalräkenskaper, kvartals- och årsberäkningar, 2022 kvartal, 2020 år
Revision in input data on air emissions from Swedish production
Data for air emissions from Swedish production are based on Statistics Sweden’s air emissions accounts with a production perspective. Since the previous publication, greenhouse gas emissions from mining activities (B05 – B09) for reference years from 2016 and onward have been reduced by between 25 and 30 percent compared with the previous publication. This is due to a change in the classifications for energy demand in the sector from 2016. A new data source with higher quality has also been applied for production emissions from aviation (H51). This revision has led to a decrease of between 30 and 50 percent for H51 compared with the previous publication.
Revisions for environmental pressures from imported products
Statistics Sweden uses the global multi-regional input-output database EXIOBASE to calculate emissions from Sweden’s imported products.
SCB uses the global multiregional input output database EXIOBASE to estimate emissions arising due to Sweden’s imports. The database is developed and maintained by a consortium led by the Norwegian University of Science and Technology.
For the production year 2022, EXIOBASE version 3.8.2 has been used. For production year 2021, EXIOBASE version 3.8.1 was used. EXIOBASE version 3.8.2 has revised greenhouse gas emissions form industrial processes compared with version 3.8.1. More information on EXIOBASE is available here:
Also for production year 2020, methane emissions from fossil oil and gas extraction in Russia and coal extraction in China are based on the EDGAR and PRIMAP databases:
EDGAR - Emissions Database for Global Atmospheric Research
The PRIMAP-hist national historical emissions time series
Results of revisions
These revisions affect the overall emissions levels. For Sweden´s consumption-based emissions arising from Swedish production, the revisions have led to an average absolute difference between production year 2022 and production year 2021 of 547 kilotonnes carbon dioxide equivalents. This amounts to 1.5 percent of the total emissions from domestic production on average. The time series profile is however largely unchanged due to the revisions.
For Sweden’s consumption-based emissions from imported products, the revisions contribute to an average absolute difference between production year 2022 and production year 2021 of 917 kilotonnes carbon dioxide equivalents. This amounts to 1.5 percent of the total emissions from imported production on average. The time series profile is also largely unchanged due to the revisions.
Definitions and explanations
These statistics form part of the environmental accounts. The Environmental Accounts are based on the National Accounts and present national environmental statistics and economic statistics in a common framework. Environmental data is systematised according to the same industry classification and areas for final use as economic data. The main goal of this systematisation is to analyse the relationship between economic and environmental performance.
The National Accounts measure gross domestic product in two different ways – from a supply perspective and from a demand perspective. The environmental accounts also measure the gross domestic product, but from an environmental perspective. Where the production perspective answers the question – “who is emitting?”, the consumption perspective answers the question “who benefits from the emissions?”
The method used to produce these statistics is based on environmentally extended input-output analysis, using the framework of the national accounts. This approach is based on the results of a recently completed research project, PRINCE (Policy Relevant Indicators for Consumption and Environment):
See also:
Statistics on environmental pressure from consumption show environmental pressure in relation to the macroeconomic balancing equation that is the basis for the national accounts. The equation for Sweden’s balance is as follows:
P +M = C + G +I+ E (equation 1)
in which P is Sweden’s GDP, M are total imports to Sweden, C is household consumption, G is general government consumption, I is gross capital formation, and E is total export to other countries from Sweden. According to the system of national accounts, all variables are presented in monetary terms. The statistics presented in this publication show greenhouse gas and other air emissions for each term in the equation. For each term, the environmental pressure is allocated to over 40 different product groups.
For household consumption, environmental pressure is presented according to the international COICOP allocation (classification of individual consumption by purpose).
Relationship to other official emissions statistics
Official statistics on greenhouse gas and other air emissions are presented from three complementary perspectives:
- From Sweden’s economy with a consumption perspective (these statistics)
- From Sweden’s economy with a production perspective
- From Sweden’s territory (territorial statistics)
Statistics Sweden is responsible for statistics with a production and consumption perspective, as a part of the system of environmental economic accounts. Statistics with a consumption perspective are unique since they present environmental pressure for all goods and services that are produced and used in the Swedish economy along their entire production chain. This is particularly interesting for Sweden since a large proportion of goods and services that are used in the Swedish economy are imported. Sweden also exports a large proportion of the domestic production.
Environmental accounts’ official statistics from a production perspective present greenhouse gas and other air emissions from the Swedish economy’s total domestic production of goods and services by sector. This system boundary represents the P-term in Equation 1 above and includes Swedish economic actors’ environmental pressure irrespective of where in the world the pressure occurs.
The Swedish Environmental Protection Agency produces official territorial statistics, presenting those environmental pressures that occur within Sweden’s borders.
All of the statistics mentioned are included in Sweden’s official statistics and they follow uniform guidelines for when and how the statistics are published, quality assurance, and documentation.
Results differ between different official statistics
The different system boundaries that are applied in the production of statistics from the three different perspectives lead to differences in the absolute emissions levels as shown in the statistics. Air emissions from a production perspective include virtually all air emissions included in territorial statistics, as well as emissions from international transport operated by Swedish economic actors. Therefore, emissions from a production perspective are in practice greater than emissions from a territorial perspective, which exclude emissions from international transport.
Sweden’s imports and exports are almost exactly balanced, with exports being slightly greater. At the same time, the greenhouse gas emissions intensity (emissions per unit production in monetary terms) for domestic production is lower in Sweden than in Sweden’s major trading partners. This means that greenhouse gas emissions presented in statistics with a consumption perspective are larger than in statistics with a production perspective, even when emissions from Sweden’s export are excluded.
The different official statistics can also be used for different purposes. Statistics from environmental accounts can be used to support policy analyses from an economic and environmental perspective, or investment and procurement decisions.
Territorial statistics are used to follow the development of emissions in relation to climate change goals in Sweden, the European Union and the United Nations. These statistics show which emissions sources are present in the country. Countries therefore have significant jurisdiction over laws and regulations that can affect emissions and can easily perform calculations of national reduction targets.
More information about the different perspectives
Statistics Sweden, environmental accounts’ air emissions accounts:
System of Environmental and Economic Accounts
Statistics Sweden, environmental accounts’ environmental pressures from consumption:
The Swedish Environmental Protection Agency and Statistics Sweden’s joint description of the statistics (in Swedish):
Tre sätt att beräkna klimatpåverkande utsläpp
Glossary of selected terms
Household consumption
Consumption by households and private citizens. Includes non-profit institutions serving households (NPISH).
General government consumption
Consumption by state, county and municipal authorities.
Investments
Investments by general government and industry, for example procurement of machines, buildings and roads. Investments can be subdivided into gross fixed capital formation, changes in inventories and the net acquisition of valuables.
Export
Foreign actors’ use of goods and services arising from Swedish production.
Final consumption/demand/use
Terms used interchangeably for the sum of general government consumption, household consumption, investment and export. “Final” refers to the fact that it is not used in the production chain, rather it is the end of the production chain.
Component
A part of final use, for example for household consumption or export. Each component generates emissions in Sweden and abroad due to import for final use and imports to be used domestically for the production of other goods and services.
Emissions from consumption, consumption perspective
Emissions arising from the consumption of goods and services in Sweden and abroad due to imports.
Emissions from production, production perspective
Emissions arising from the production of goods and services in the economy.
Next publishing will be
The next publication of statistics on environmental pressures from consumption will be in September 2023.
Statistical Database
More information is available in the Statistical Database
Feel free to use the facts from this statistical news but remember to state Source: Statistics Sweden.