
First quarter 2026
GDP decreased in the first quarter 2026
Statistical news from Statistics Sweden 2026-05-29 8.00
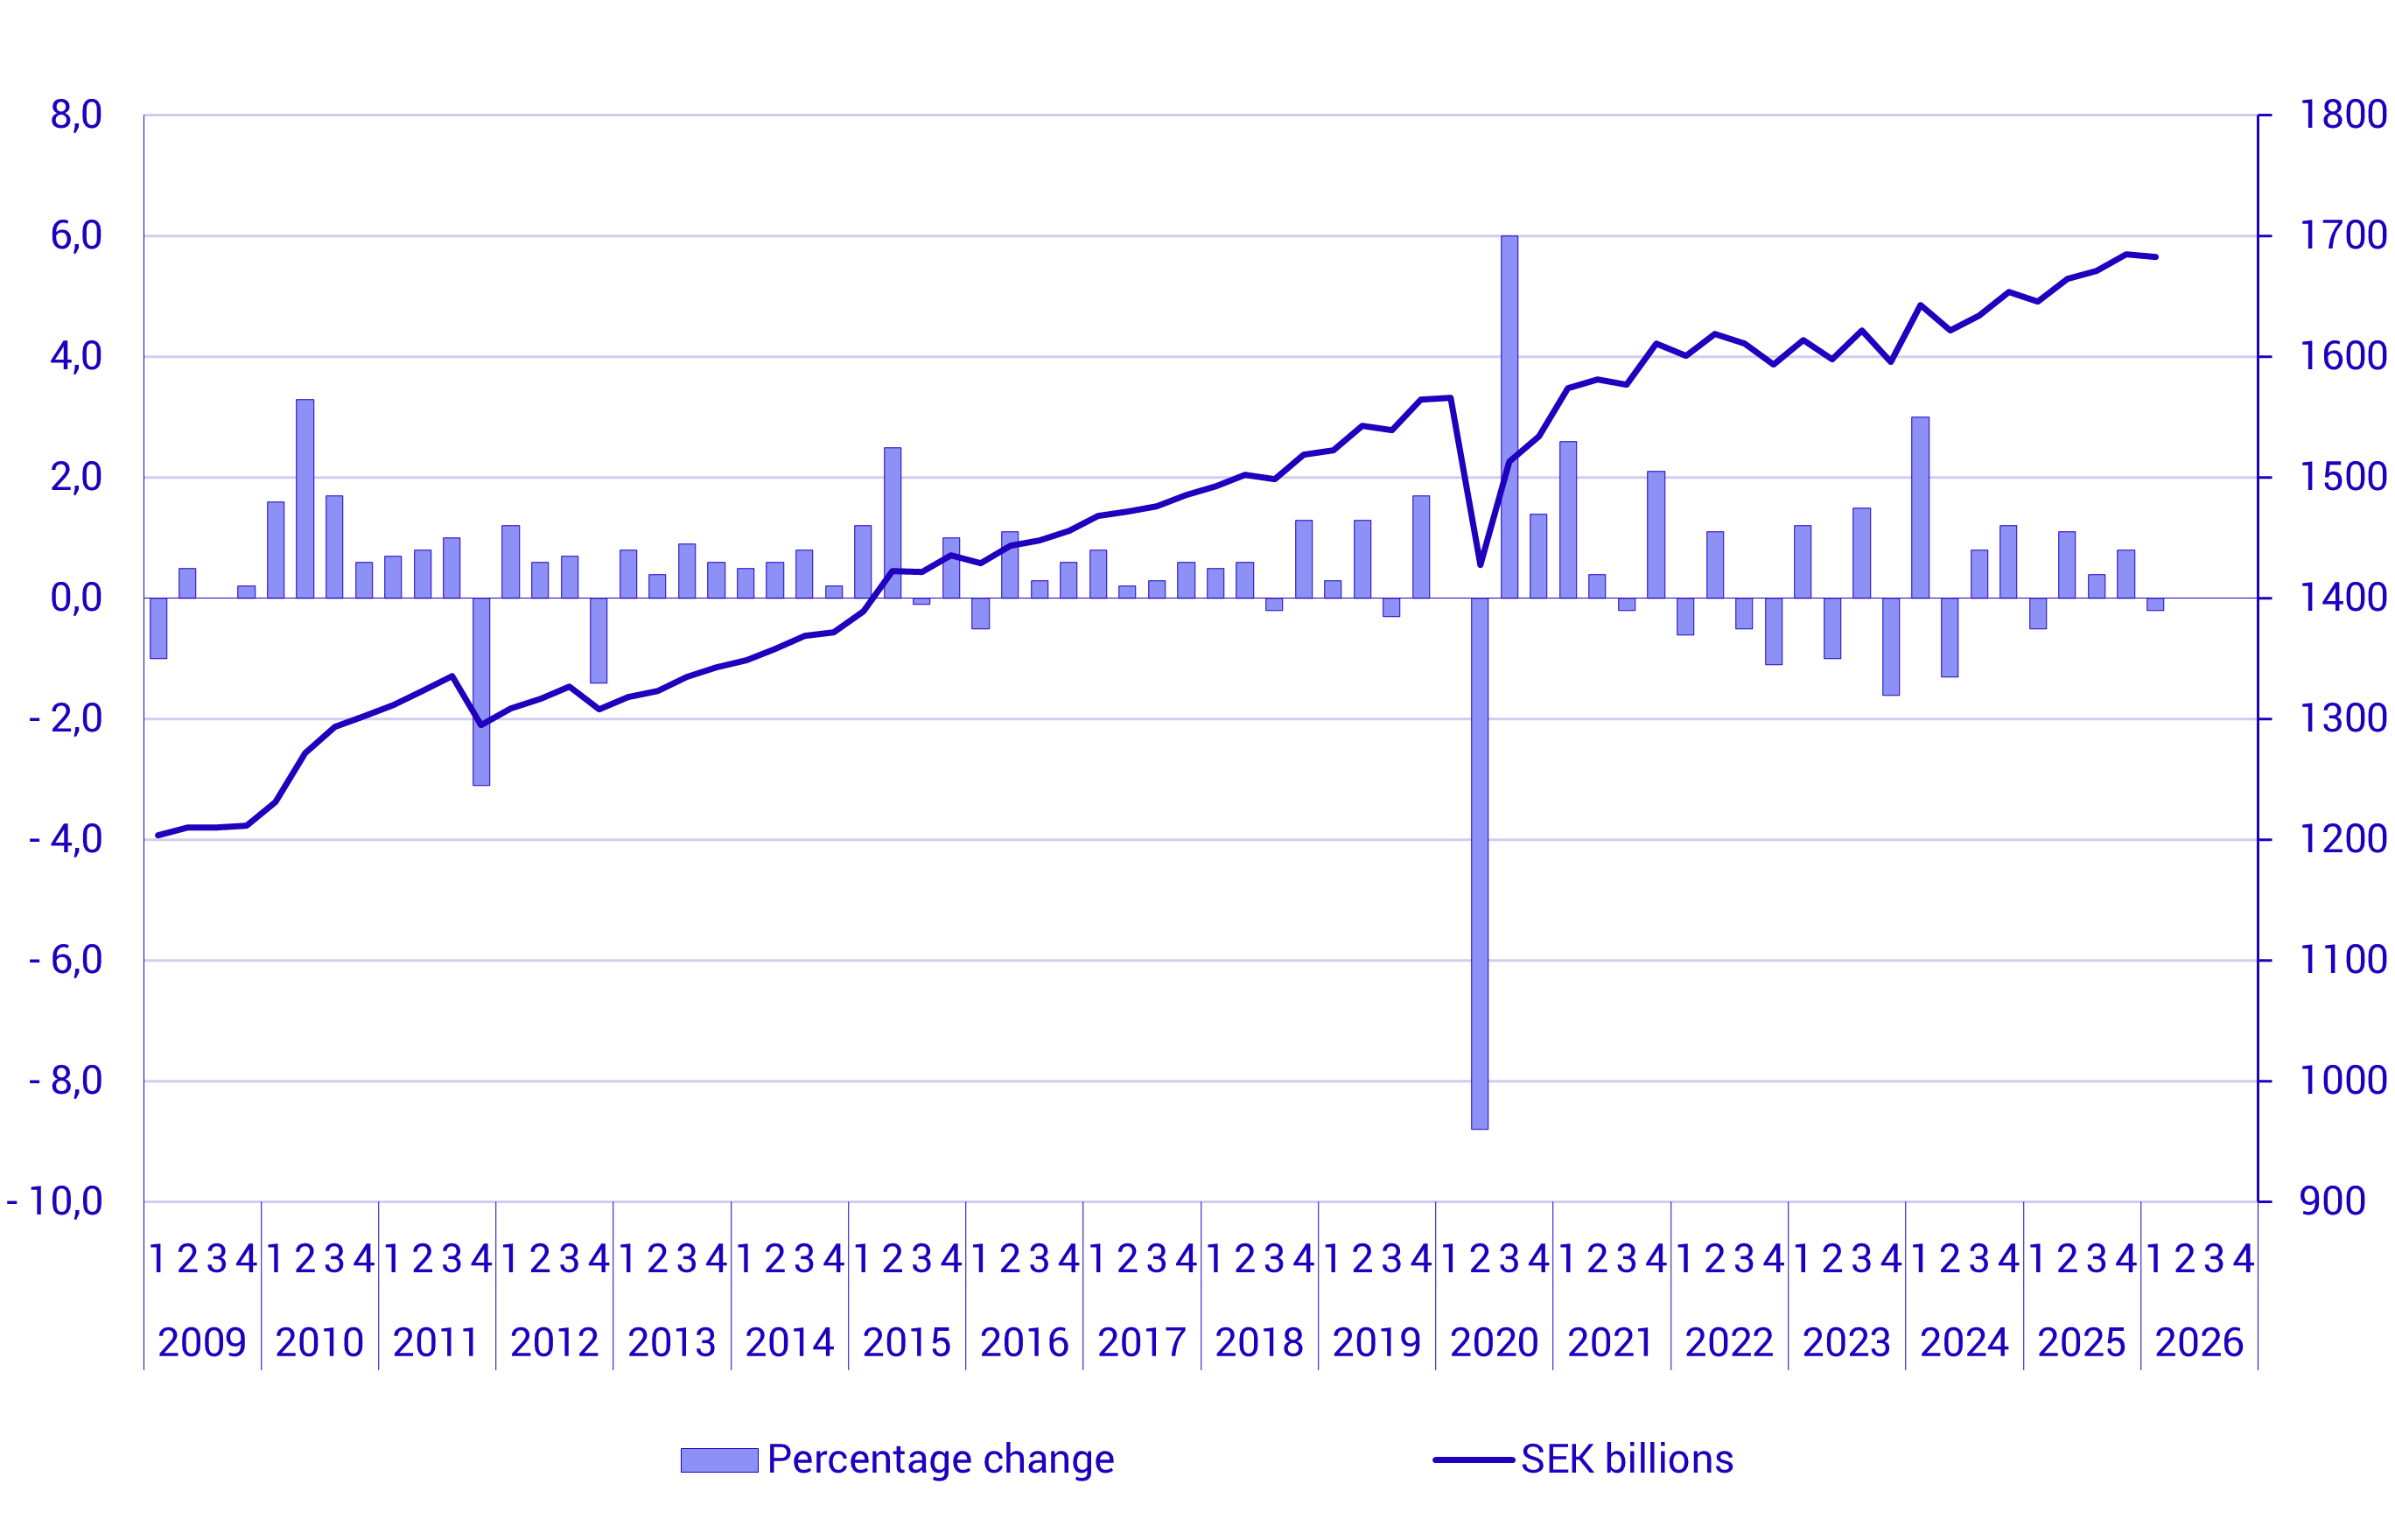
GDP decreased by 0.2 percent in the first quarter of 2026, seasonally adjusted and compared with the previous quarter. Inventories and household consumption contributed positively while gross fixed capital formation and central government final consumption counteracted growth. Calendar adjusted and compared with the first quarter of 2025, GDP increased by 2.0 percent.
- GDP decreased slightly in the first quarter of the year, following large increases in central government expenditure in the preceding quarter, says Jessica Engdahl, head of section at the National Accounts.
What is GDP?
Gross domestic product, GDP, is defined as the value of all goods and services produced in the country. GDP is used as a measure of economic growth and is published quarterly.
Summary of the first quarter
Percentages refer to seasonally adjusted volume changes compared with the previous quarter, unless otherwise stated. Tables available at the end of this statistical news also show volume changes in relation to the corresponding quarter the previous year.
The figures on labour input for the first quarter of 2026 contain greater uncertainty than usual due to problems with non-response in the Labour Force Surveys. The non‑response was caused by technical issues in the data collection tool and may have affected the estimates.
- Household final consumption increased by 0.6 percent. Expenditures on transport and housing contributed most to the increase.
- General government consumption decreased by 2.1 percent. Central government consumption decreased by 7.6 percent while local and regional governments increased by 0.1 percent.
- Changes in inventories contributed postively to GDP-growth by 0.8 percentage points. An increase in industrial inventories contributed the most.
- Gross fixed capital formation fell by 2.3 percent. The decrease was mainly explained by investments in buildings and constructions. General government investments fell by 9.6 percent following large increases in the previous quarter. Investments by market producers increased by 0.2 percent.
- Exports increased by 2.2 percent and imports rose by 2.5 percent. Net exports contributed negatively to GDP by 0.1 percentage points.
- Value added in the business sector decreased by 0.2 percent. In the goods-producing industries, value added rose by 1.1 percent and value added in the service-producing industries decreased by 0.8 percent. Government value added fell by 0.2 percent.
- The total number of employed persons increased by 0.1 percent. The number of hours worked fell by 0.3 percent in the whole economy and by 0.5 percent in the business sector. Labour productivity in the business sector increased by 0.3 percent.
- Household real disposable income increased by 1.0 percent compared with the first quarter of 2025.
- Public administration showed a deficit of SEK 25.2 billion in the first quarter of 2026. This can be compared with a deficit of SEK 21.9 billion during the same quarter in 2025.
GDP, seasonally adjusted, volume changes and levels in constant prices (reference year 2025), SEK billion:
GDP - Expenditure approach
| Current prices, SEK millions | Seasonally and calendar adjusted values | Non-adjusted values | ||
|---|---|---|---|---|
| 2026 q1 | Volume change, cf. with previous quarter,% | Contribution to GDP volume change, cf. with previous quarter,% points | Volume change, cf. with corresponding quarter last year,% | |
| GDP at market prices | 1 624 444 | -0.2 | -0.2 | 2.0 |
| Imports | 837 815 | 2.5 | -1.3 | 6.1 |
| Goods (SPIN A01–F43) | 506 701 | 2.2 | -0.6 | 4.3 |
| Services (SPIN G45–T98) | 331 114 | 3.0 | -0.6 | 8.9 |
| Total domestic supply | 2 462 259 | 0.7 | 3.4 | |
| Household consumption expenditure | 743 655 | 0.6 | 0.3 | 2.5 |
| Households excluding NPISH | 722 058 | 0.6 | 0.3 | 2.5 |
| NPISH [1] | 21 597 | 1.2 | 0.0 | 3.5 |
| Public consumption expenditure | 430 798 | -2.1 | -0.6 | 1.3 |
| Central government | 121 549 | -7.6 | -0.6 | 4.5 |
| Municipalities [2] | 309 249 | 0.1 | 0.0 | 0.1 |
| Gross fixed capital formation | 374 106 | -2.3 | -0.6 | 5.3 |
| Inventories [3] | 37 522 | 0.8 | ||
| Exports | 876 178 | 2.2 | 1.2 | 3.7 |
| Goods (SPIN A01–F43) | 576 446 | 0.5 | 0.2 | 1.2 |
| Services (SPIN G45–T98) | 299 732 | 5.5 | 1.0 | 9.0 |
| Total domestic demand | 2 462 259 | 0.7 | 3.4 | |
GDP - Production approach
| Seasonally and calendar adjusted values | Calendar adjusted values | |
|---|---|---|
| Volume change, cf. with previous quarter,% | Volume change, cf. with corresponding quarter last year,% | |
| GDP at market prices | -0.2 | 2.0 |
| Goods producers (SNI A01-F43) | 1.1 | 3.5 |
| Manufacturing (SNI C10-C33) | 1.3 | 4.0 |
| Service producers (SNI G45-T98) | -0.8 | 1.8 |
| Market production [1] | -0.2 | 2.3 |
| Government production | -0.2 | 0.3 |
| Hours worked [2] | -0.3 | -0.8 |
Revisions
The quarters of 2025 have been revised in non-adjusted and seasonally adjusted values compared to the previous publication. GDP-growth in the current and previous publications is shown in the tables below.
GDP growth, non-adjusted and compared with the corresponding quarter of the previous year, percent, current and previous publication
| 2025 q1 | 2025 q2 | 2025 q3 | 2025 q4 | Calendar year 2025 | 2026 q1 | |
|---|---|---|---|---|---|---|
| 2026‑05‑29 | -0.5 | 2.2 | 2.3 | 2.0 | 1.5 | 2.0 |
| 2026‑02‑27 | -0.2 | 1.7 | 2.6 | 2.1 | 1.5 |
GDP growth, seasonally adjusted and compared with the previous quarter, percent, current and previous publication
| 2025 q1 | 2025 q2 | 2025 q3 | 2025 q4 | 2026 q1 | |
|---|---|---|---|---|---|
| 2026‑05‑29 | -0.5 | 1.1 | 0.4 | 0.8 | -0.2 |
| 2026‑02‑27 | -0.3 | 1.0 | 0.8 | 0.5 |
Annual accounts 2024
In connection with this publication, the detailed annual calculation for 2024 is also published, and the quarters of 2024 have therefore been adjusted to the newly established annual levels. As a result of the annual calculation, the development for the full year 2024 has been revised upward by 1.0 percentage points, from 1.0 to 2.0 percent in non-adjusted values.
Changes in the publication
More detailed reporting of hours worked
At the request of users, the reporting of hours worked has been changed from units of millions of hours to tens of thousands of hours.
These tables are affected:
Labour input (ESA2010) by industrial classification SNI 2007. Year 1980 - 2024. PxWeb
Labour input (ESA2010) by industrial classification (NACE Rev. 2), observations and quarter. PxWeb
Hours worked (ESA2010) by industrial classification (NACE Rev. 2), observations and quarter. PxWeb
Household consumption according to COICOP backcast to 1950
The table on household consumption has been expanded with a backcast at the COICOP 2‑digit level for the period 1980–1950.
Household consumption expenditure (ESA2010) by purpose COICOP. Year 1950 - 2024. PxWeb
Addition of contribution tables
The Statistical Database has been expanded with a table showing the contributions to GDP by expenditure approach by type of use for the two most recent years. In the long term, this will replace the two charts currently published.
Contributions to change in GDP (ESA2010), percentage units. Constant prices. Quarter 2025K1 - 2026K1. PxWeb
Addition of GDP per capita tables
Two GDP per capita tables have been added: a quarterly table and an annual table.
Quarterly: GDP per capita (ENS2010). Quarter 1980K1 - 2026K1. PxWeb
Annual: GDP per capita (ESA2010). Year 1980 - 2024. PxWeb
Changes for users retrieving information with the help of an API
In the fall of 2025, PxWebApi v1 was replaced by PxWebApi v2. PxWebApi v1 will remain up and running until December 31st, 2026, but will after that no longer be functional. For more information and instructions on conversion, please see PxWebApi v2