Social security in Sweden 1993–2014:
Expenditure for social protection increases, but decreases in relation to GDP
Statistical news from Statistics Sweden 2016-03-31 9.30
Social protection expenditures increased during 2014 in current prices but decreased slightly in relation to GDP. In 2014 social protection was 29.7 percent of GDP. The corresponding figure for 2013 was 30.0 percent.
Total expenditure for social protection increased during 2014 by SEK 31.1 billion, or about 2.8 percent. The corresponding increase between 2012 and 2013 was 4.9 percent.
As a share of GDP, expenditure for social protection has varied from year to year. During the whole period the percentage fell from 36.1 percent 1993 to 29.7 percent 2014. Between 1993 and 2000 the share decreased steadily, and in 2000 it amounted to 28.3 percent. In the 2000s, the proportion varied between 27.4 percent (in 2007) to 30.4 percent (in 2003).
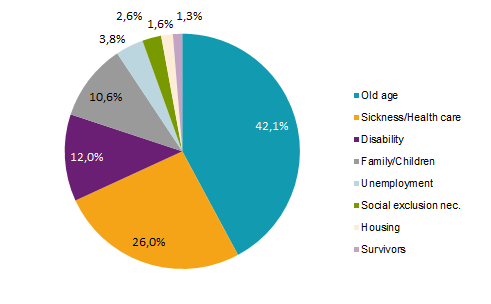
Expenditure for elderly was the largest
The largest expenditure was on the elderly and on health and medical care. Together these expenditures amounted to 68 percent of social benefits in 2014. This is followed by expenditure for disability and family/children that constitute 12 and 11 percent of total social benefits.
Expenditure for the elderly increased by SEK 10.5 billion in current price, an increase of 2.2 percent between 2013 and 2014. The increase is significantly lower than it has been the past two years due to the brake in the retirement system that gave several pensioners lower income- and supplementary pension. Old age pension, which is the largest item of expenditure on old age, increased by only 1.8 percent in 2014, compared with an increase of 7.4 percent between 2012 and in 2013.
Expenditure for health and medical care increased by SEK 14.5 billion, or about 5.2 percent. The expenditures for paid sick leave account for the largest increase, about 6.9 percent. The sickness benefit paid by the Social Insurance Agency increased by 13.7 percent compared to 2013 while the sick pay from employers fell by 4 percent.
Expenditure for unemployment decreased with SEK 3.5 billion in 2014 compared to 2013, a decrease of 7.4 percent. Most benefits decreased, but the payment of unemployment benefits decreased the most, by SEK 1.1 billion. The cost for introduction benefit for newly arrived in Sweden, however, increased by 0.8 billion.
Social exclusion was the function that increased the most in percentage terms between 2013 and 2014, it increased by 12.1 percent (SEK 3.2 billion). The cost increase is largely explained by to higher costs for asylum accommodation, which is due to the increasing number of asylum seekers in 2014 compared with the year before.
Expenditure for family and children increased by 3.5 percent while expenditure for disability increased only by 0.8 percent between 2013 and 2014.
| Function | 2009 | 2010 | 2011 | 2012 | 2013 | 2014 |
|---|---|---|---|---|---|---|
|
1. Sickness/Health care
|
246,262 | 247,097 | 260,242 | 270,422 | 281,976 | 296,520 |
|
2. Disability
|
137,946 | 134,086 | 132,486 | 132,783 | 135,249 | 136,382 |
|
3. Old Age
|
392,335 | 399,970 | 417,419 | 442,767 | 470,415 | 480,923 |
|
4. Survivors
|
18,077 | 17,190 | 16,362 | 16,131 | 15,632 | 14,681 |
|
5. Family/Children
|
99,486 | 103,405 | 107,636 | 111,716 | 116,669 | 120,704 |
|
6. Unemployment
|
40,635 | 45,444 | 40,100 | 43,633 | 47,184 | 43,714 |
|
7. Housing
|
14,746 | 15,282 | 15,551 | 16,869 | 17,317 | 18,291 |
|
8. Social exclusion nec.
|
22,030 | 23,640 | 23,767 | 24,519 | 26,592 | 29,817 |
|
Expenditures for social protection benefits
|
971,517 | 986,114 | 1,013,563 | 1,058,840 | 1,111,034 | 1,141,032 |
|
As a % of GDP
|
29.5 | 28.0 | 27.7 | 28.7 | 29.5 | 29.1 |
|
Administration costs/Other expenditures
|
18,095 | 19,046 | 19,268 | 20,815 | 21,215 | 22,405 |
|
Social protection expenditure
|
989,612 | 1,005,160 | 1,032,831 | 1,079,655 | 1,132,249 | 1,163,437 |
|
As a % of GDP
|
30.1 | 28.6 | 28.2 | 29.3 | 30.0 | 29.7 |
International comparisons
In the early 1990s Sweden had the highest social protection expenditure in relation to GDP compared to other countries in the EU. In recent years Sweden has been just below the EU average.
The different taxation regulations pose a major problem for international comparisons. Some countries regulate taxes on certain benefits while others do not. In addition. some benefits in certain countries consist of tax deductions while other countries pay the benefit directly.
Slightly more than half of the social protection benefits in Sweden are cash benefits. Most of these cash benefits are taxable. If taxation is taken into account, the percentage of GDP from benefits in 2014 fell from 29.1 percent including tax to 25.8 percent excluding tax.
| Country | 2009 | 2010 | 2011 | 2012 | 2013 | ||||||
|---|---|---|---|---|---|---|---|---|---|---|---|
|
Belgium
|
30.0 | 29.4 | 29.7 | 29.9 | 30.2 | ||||||
|
Denmark
|
32.8 |
p
|
32.8 |
p
|
32.3 |
p
|
32.2 |
p
|
33.3 |
p
|
|
|
Finland
|
29.0 | 29.2 | 28.8 | 30.1 | 31.2 | ||||||
|
France
|
32.6 |
b
|
32.7 | 32.5 | 33.3 | 33.7 |
p
|
||||
|
Greece
|
27.3 |
p
|
28.6 |
p
|
30.4 |
p
|
31.6 |
p
|
: | ||
|
Ireland
|
23.9 | 24.5 | 23.2 | 23.0 | 22.0 | ||||||
|
Italy
|
28.8 | 28.8 | 28.5 | 29.3 |
p
|
29.8 |
p
|
||||
|
Luxembourg
|
23.8 | 22.9 | 22.3 | 23.0 | 23.1 | ||||||
|
The Netherlands
|
29.3 | 29.9 | 30.1 | 30.9 | 31.3 |
bp
|
|||||
|
Portugal
|
25.8 | 25.8 | 25.8 | 26.4 | 27.6 | ||||||
|
Spain
|
24.4 | 24.7 |
p
|
25.4 |
p
|
25.5 |
p
|
25.7 |
p
|
||
|
United Kingdom
|
29.1 | 28.8 | 28.7 | 28.8 |
p
|
28.1 |
p
|
||||
|
Sweden
|
30.1 | 28.6 | 28.2 | 29.3 | 30.0 |
p
|
|||||
|
Germany
|
30.5 | 29.8 | 28.6 | 28.7 | 29.0 |
p
|
|||||
|
Austria
|
29.6 | 29.6 | 28.9 | 29.2 | 29.8 | ||||||
|
Total for the EU15
|
29.5 |
p
|
29.3 |
p
|
29.1 |
p
|
29.5 |
p
|
: | ||
|
Cyprus
|
19.3 | 20.1 | 20.8 | 21.0 | 22.3 | ||||||
|
Estonia
|
18.8 | 17.6 | 15.6 | 15.0 | 14.8 | ||||||
|
Latvia
|
16.7 | 18.1 | 15.1 | 14.2 | 14.4 |
p
|
|||||
|
Lithuania
|
21.0 | 18.9 | 16.9 | 16.3 | 15.3 |
p
|
|||||
|
Malta
|
19.0 | 18.7 | 18.2 | 18.5 | 18.7 | ||||||
|
Poland
|
20.4 | 19.6 | 18.6 | 17.7 |
p
|
: | |||||
|
Slovakia
|
18.5 | 18.3 | 17.9 | 18.1 | 18.4 |
p
|
|||||
|
Slovenia
|
23.7 | 24.4 | 24.5 | 24.9 | 25.0 |
p
|
|||||
|
Czech Republic
|
20.1 | 20.1 | 20.1 | 20.5 | 20.2 | ||||||
|
Hungary
|
22.9 | 22.7 | 21.7 | 21.4 | 20.9 | ||||||
|
Total for the EU25
|
28.9 |
p
|
28.7 |
p
|
28.4 |
p
|
28.8 |
p
|
: | ||
|
Bulgaria
|
16.1 | 17.3 | 16.7 | 16.7 | 17.6 | ||||||
|
Croatia
|
20.7 | 20.8 | 20.4 | 20.9 | 21.7 | ||||||
|
Romania
|
16.9 | 17.3 | 16.4 | 15.4 | 14.8 | ||||||
|
Total for the EU28
|
28.7 |
p
|
28.6 |
p
|
28.2 |
p
|
28.6 |
p
|
: | ||
|
Iceland
|
23.9 | 23.3 | 23.9 | 23.7 | 23.6 | ||||||
|
Norway
|
25.4 | 25.1 | 24.7 | 24.5 | 25.0 | ||||||
|
Switzerland
|
25.4 | 25.5 | 25.4 | 26.3 | 27.0 | ||||||
|
Serbia
|
: | 23.9 | 22.7 | 24.0 | 23.3 | ||||||
|
Turkey
|
14.1 | 13.5 | 13.2 | 13.8 | : | ||||||
p) provisional data b) break in time series :) not available
These data are also available in a database on Eurostat’s website under: Population and social conditions - Social protection.
Definitions and explanations
Social protection is defined here as all services from public or private organisations with the purpose of reducing the burden on households and individuals from specially defined risks or to meet specially defined needs. A prerequisite is that these services do not require a return of services and that they are not based on individual arrangements. The benefits may be either in cash or in kind.
Feel free to use the facts from this statistical news but remember to state Source: Statistics Sweden.