Purchasing Power Parities:
Swedish households’ Actual Individual Consumption 11 percent above EU average
Statistical news from Statistics Sweden 2016-12-16 9.30
Swedish households’ Actual Individual Consumption (AIC) per capita was 11 percent above the average for the 28 EU countries in 2015. Sweden ranks tenth in Europe.
Actual Individual Consumption (AIC) consists of goods and services that are consumed by the individual, irrespective of whether these goods and services are purchased and paid for by households, by the government or by non-profit organisations. In international comparisons, AIC is often seen as the preferable indicator for households’ actual standard of living.
The dispersion in AIC per capita among the 28 EU countries and Norway, Iceland and Switzerland ranges from 37 percent above to 47 percent below the EU-28 average. Luxembourg tops the list with 37 percent above, followed by Norway, which is 33 percent above, and Switzerland, which is 28 percent above the average. However, it should be noted that Norway, Switzerland and Iceland are not included in the EU-28 average.
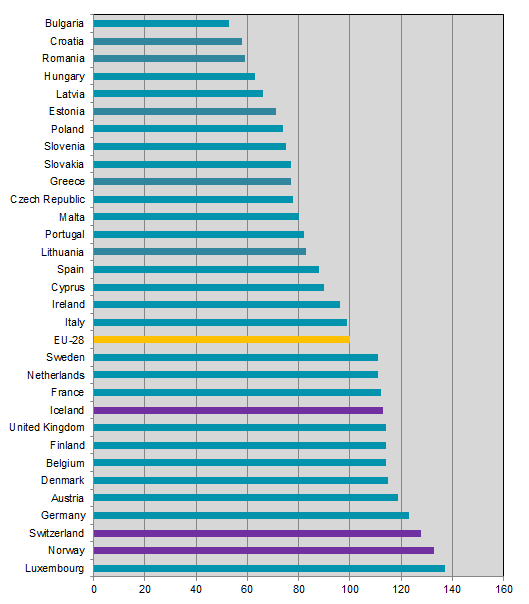
Note: Sorted firstly by value and secondly alphabetically.
GDP per capita is mainly an indicator of economic activity in a particular country.
In 2015, Sweden’s GDP per capita was 24 percent above the EU-28 average. Luxembourg had by far the highest GDP per capita, at 164 percent above the EU average. The high figure is in part due to the large number of foreign residents who work in the country and thus contribute to the GDP, although they are not included in the population statistics. Bulgaria has the lowest figure in this comparison - 53 percent below the average for the EU countries.
| AIC volume index per capita | GDP volume index per capita | ||||||
|---|---|---|---|---|---|---|---|
| 2013 | 2014 | 2015 | 2013 | 2014 | 2015 | ||
|
Luxembourg
|
145 | 143 | 137 | 261 | 267 | 264 | |
|
Norway
|
135 | 134 | 133 | 184 | 175 | 160 | |
|
Switzerland
|
133 | 131 | 128 | 164 | 163 | 162 | |
|
Austria
|
123 | 122 | 119 | 131 | 130 | 128 | |
|
Germany
|
123 | 124 | 123 | 124 | 125 | 124 | |
|
Denmark
|
116 | 115 | 115 | 128 | 127 | 127 | |
|
Netherlands
|
115 | 113 | 111 | 134 | 131 | 128 | |
|
Belgium
|
115 | 115 | 114 | 120 | 120 | 119 | |
|
Finland
|
114 | 114 | 114 | 113 | 111 | 109 | |
|
France
|
114 | 112 | 112 | 109 | 107 | 106 | |
|
United Kingdom
|
114 | 115 | 114 | 107 | 109 | 108 | |
|
Sweden
|
113 | 112 | 111 | 125 | 124 | 124 | |
|
Iceland
|
112 | 113 | 113 | 117 | 118 | 123 | |
|
EU-28
|
100 | 100 | 100 | 100 | 100 | 100 | |
|
Italy
|
100 | 98 | 99 | 99 | 97 | 96 | |
|
Ireland
|
95 | 94 | 96 | 133 | 137 | 177 | |
|
Cyprus
|
89 | 89 | 90 | 84 | 81 | 82 | |
|
Spain
|
86 | 87 | 88 | 90 | 90 | 90 | |
|
Portugal
|
81 | 81 | 82 | 77 | 77 | 77 | |
|
Greece
|
80 | 79 | 77 | 72 | 70 | 68 | |
|
Malta
|
79 | 79 | 80 | 86 | 86 | 88 | |
|
Lithuania
|
79 | 81 | 83 | 73 | 75 | 75 | |
|
Czech Republic
|
76 | 78 | 78 | 84 | 86 | 87 | |
|
Slovenia
|
75 | 76 | 77 | 77 | 77 | 77 | |
|
Slovakia
|
75 | 76 | 75 | 81 | 83 | 83 | |
|
Poland
|
74 | 74 | 74 | 67 | 68 | 69 | |
|
Estonia
|
68 | 69 | 71 | 75 | 76 | 75 | |
|
Latvia
|
64 | 65 | 66 | 62 | 64 | 64 | |
|
Hungary
|
62 | 62 | 63 | 67 | 68 | 68 | |
|
Croatia
|
59 | 59 | 58 | 59 | 59 | 58 | |
|
Romania
|
54 | 56 | 59 | 55 | 55 | 57 | |
|
Bulgaria
|
49 | 51 | 53 | 46 | 46 | 47 | |
Source: Eurostat and SCB Norway, Iceland and Switzerland are not EU Member States and are therefore not included in the EU-28 average. Sorted firstly by AIC in 2015 and secondly in alphabetical order.
Definitions and explanations
Purchasing power parities (PPP) are currency conversion rates that are applied in order to convert economic indicators from national currency to artificial common currency, called Purchasing Power Standard (PPS), which equalises the purchasing power of different national currencies and enables meaningful volume comparison between countries.
PPP is the ratio between the amount in the countries’ domestic currency that is needed in order to buy the same basket of goods and services.
GDP is first calculated in the domestic currency and later converted with an artificial currency, Purchasing Power Standard (PPS). GDP per capita adjusted with purchasing power reflects the difference in volume in real terms between countries.
Information on Eurostat revision of PPP time series
Eurostat publishes a revised time series of Purchasing Power Parities (PPP), on 13 December. The revision starts from 1995. The revision was undertaken for three main reasons:
• to incorporate the latest national accounts data that was produced under ESA2010 by all Member States and other countries;
• to harmonise, to the maximum extent, the methodology used to calculate the PPPs for all reference years; and
• to introduce, for all reference years, the latest classification of expenditures.
Purchasing Power Parities
Eurostat’s publishing of Purchasing Power Parities
For more informatio, see Eurostat´s newsrelease
The Eurostat website and database
Next publishing will be
The next statistical news will be published on 18 December 2017 at 09:30.
Statistical Database
More information is available in the Statistical Database
Feel free to use the facts from this statistical news but remember to state Source: Statistics Sweden.