Research and development in Sweden 2025
Enterprises contributed the most to the increase in Sweden’s R&D expenditure in 2025
Statistical news from Statistics Sweden 2026-10-29 8.00
Sweden’s total intramural expenditure on research and development (R&D) increased to SEK 241 billion in 2025. The personnel employed in R&D activities increased as well to 111 366 full-time equivalents. R&D expenditure as a share of GDP, reached 3.62 percent, the second highest level on record. The business enterprise sector made up the largest share of R&D expenditure at 74 percent, followed by the higher education sector at 21 percent.
During 2025, intramural research and development (R&D) expenditure amounted to SEK 241 billion. This was an increase of 4 percent, or just under SEK 9.4 billion compared to 2024 in fixed prices. The increase was primarily driven by the business enterprise sector where R&D expenditure rose by SEK 8.5 billion, corresponding to a 5 percent increase. The government sector also saw a significant increase of 12 percent, equalling SEK 1.2 billion. The increase in the government sector can primarily be attributed to the regional governments as well as certain government agencies, in particular the Swedish Defence Research Agency (FOI), who had higher R&D expenditure in 2025 compared to the previous year.
In contrast, the higher education sector reduced their R&D expenditure in fixed prices by SEK 322 million, roughly one percent lower compared to 2024. The private non-profit sector, however, saw a sharp increase at 23 percent, thereby contributing to SEK 100 million in R&D expenditures. Part of this increase is because more organisations were included in the survey for 2025 than in previous years.
The R&D intensity (R&D expenditure as a share of GDP) also rose after having declined during 2024. In 2025 it represented 3.62 percent of GDP, which can be compared to 3.53 in the year prior. The increase is attributable to the R&D expenditure rising more quickly than GDP, which increased by 1.4 percent, and means that a relatively larger share of Swedish resources was committed to R&D compared to the rest of the economy. This was primarily driven by the high growth in the business enterprise sector.
“Despite the relatively strong GDP growth of 1.4 percent, R&D expenditure grew even quicker. This means that a larger share of resources in Sweden was directed towards R&D activities, compared to almost all previous years”, according to Andres Quinones, statistician at Statistics Sweden.
R&D-expenditure reaches its second highest level

The number of full-time equivalents within R&D is increasing
This statistical news is limited to reporting only on the internal personnel, i.e. persons employed directly at the R&D performer.
During 2025 the internal R&D personnel increased by 5 percent compared to 2024 and totalled 111 366 full-time equivalents. The increase equated to 5 468 full-time equivalents. Of these, 5 121 were researchers, product developers or equivalent, whilst the remaining 347 belonged to the category of supporting staff, meaning staff responsible for supportive functions like technical or administrative tasks in connection to R&D activities. As a result, researchers, product developers or equivalent accounted for barely 89 percent of the internal personnel as counted in full-time equivalents.
The largest increase, in terms of amount, was found in the business enterprise sector whose number of full-time equivalents rose by 4 433, corresponding to a 6 percent increase. The largest relative change was in the government sector which increased by 12 percent. This increase was also the second largest in full-time equivalents at 742. The higher education sector increased by about 1 percent, 299 full-time equivalents, and the private non-profit sector saw a decrease of 2 percent, or 6 full-time equivalents.
Researchers, product developers or equivalent have driven the growth in personnel
Skewed gender distribution in the enterprises
Researchers, product developers or equivalent as an occupation made up a clear majority of the R&D personnel within all sectors. The distribution was however somewhat different between sectors, both in terms of occupation and gender. In the business enterprise sector, researchers made up 88 percent of the personnel. The corresponding share in the government sector was 74 percent, whilst 97 percent of the full-time equivalents were researchers, product developers or equivalent in the higher education sector.
In total, the personnel were made up of 66 percent men and 34 percent women. Within researchers, product developers or equivalent, the share of men was slightly higher at 67 percent and the share of women 33 percent. For the supporting staff this split was 58 percent men and 42 percent women.
The difference in the distribution was driven by the business enterprise sector, where men accounted for 72 percent and women 28 percent of the personnel, which was the same share as in 2023. Both the government and higher education sector had a relatively equal distribution among the genders at 49 and 51 percent, and 51 and 49 percent men and women in the sectors respectively.
Large majority of researchers, developers or equivalent are men - but limited to the business enterprise sector
The business enterprise sector both financed and performed a majority of R&D
As a share of R&D expenditure the business enterprise sector made up almost 74 percent, which was an increase from 73 percent in 2024. When looking at the source of funding for R&D instead, the business enterprise sector made up 63 percent of the total means for R&D in Sweden. 84 percent of the R&D performed in the business enterprise sector was funded either by the enterprise itself or with means form other enterprises. Funds from the rest of the world accounted for 12 percent of the financing in the business enterprise sector. Similarly, it was common for the funding in the government sector to stem from the sector itself. In this case, 85 percent of the funds had their origin within the government sector, either through the R&D performing organisation itself or through other public entities.
In contrast, the higher education sector only financed itself at 5 percent. Instead, 68 percent of funds were received from the government sector. The private non-profit sector also made up a significant portion of the funding for the higher education sector at 15 percent. The government sector also financed 36 percent of the R&D performed in the private non-profit sector. In total, the government sector was the source of funding for 22 percent of all R&D performed in Sweden, making it the second largest funder after the business enterprise sector.
The business enterprise and government sector financed over 80 percent of R&D activity in Sweden
| Source of funds | Performing sector | ||||
|---|---|---|---|---|---|
| Business enterprise sector | Government sector | Higher education sector | Private non-profit sector | Total | |
| Business enterprise sector | 84% | 8% | 2% | 5% | 150 791 |
| Government sector | 5% | 85% | 68% | 36% | 53 148 |
| Higher education sector | 0% | 1% | 5% | 12% | 2 926 |
| Private non-profit sector | 0% | 1% | 15% | 28% | 8 082 |
| Rest of the world | 12% | 6% | 9% | 18% | 25 851 |
| Total | 177 916 | 11 189 | 51 153 | 540 | 240 798 |
Large differences in fields of research between sectors
R&D expenditure in the government and higher education sector is categorised through the classification system Fields of research and development (FORD) into one of six main fields. In total, the field medical and health sciences made up 34 percent of all expenditures and was the largest FORD within both sectors. The second largest share of total R&D was natural sciences at 24 percent, followed by engineering and technology, 16 percent, social sciences, 15 percent, and humanities and arts, as well as agricultural and veterinary sciences, both making up 5 percent of the R&D expenditure.
There were however large differences between the two sectors. Engineering and technology, together with social sciences, were the only two fields with a relatively equal share in the sectors. Medical and health sciences, on the other hand, represented 56 percent of R&D expenditure in the government sector, but only 30 percent in the higher education sector. Natural sciences instead had a larger share in the higher education sector where it made up 27 percent of R&D expenditure, in contrast to 14 percent in the government sector. Both humanities and the arts, and agricultural and veterinary sciences were significantly larger, albeit at a low level, in the higher education sector where they each accounted for 6 percent, in comparison to 1 percent each in the government sector.
R&D within medical and health sciences more common in the government sector compared to the higher education sector
R&D expenditures were highly concentrated to a few industries in the business enterprise sector
Enterprises within the five largest industries made up 72 percent of the business enterprise sector’s total R&D expenditure. Among these, the largest was the Manufacture of motor vehicles and other transport equipment (SNI 29-30), whose R&D expenditure was just over SEK 47 billion, corresponding to 27 percent of the entire sector. Enterprises in the IT and telecommunication industries (SNI 61-63) made up the second largest share of R&D at just under SEK 34 billion, or 19 percent of the sector. Together with the industry Manufacture of machinery and equipment (SNI 28), SEK 17 billion, these three together made up 55 percent of the sector’s R&D expenditure.
In general, the concentration to these industries has fallen slightly since 2023. Back then, the three largest industries made up 59 percent of the sector’s R&D expenditure, and the five largest industries made up 77 percent. The largest change among these industries can be found in Scientific research and development (SNI 72), where R&D expenditure shrunk by almost SEK 2 billion. The Manufacture of machinery and equipment (SNI 28) also saw its R&D expenditure reduce by almost SEK 1 billion while the other industries increased theirs. Both Manufacture of motor vehicles and other transport equipment (SNI 29-30) and Manufacture of basic pharmaceutical products and pharmaceutical preparations (SNI 21) had about SEK 1 billion higher R&D expenditures. IT and telecommunication industries (SNI 61-63) had SEK 600 million higher R&D expenditure in 2025 compared to 2023.
It should be noted that Statistics Sweden has updated its classification of industries, which may impact comparisons over time. More information on this can be found at the bottom of the page under Updated standards for classification.
A few industries dominate R&D expenditure
| 2023 | 2025 | |||
|---|---|---|---|---|
| Industry | SEK Millions | Share | SEK Millions | Share |
| 29–30 Manufacture of motor vehicles and other transport equipment | 46 168 | 28% | 47 254 | 27% |
| 61–63 IT and telecommunication industries | 33 274 | 20% | 33 873 | 19% |
| 28 Manufacture of machinery and equipment | 18 294 | 11% | 17 357 | 10% |
| 72 Scientific research and development | 16 703 | 10% | 14 790 | 8% |
| 21 Manufacture of basic pharmaceutical products and pharmaceutical preparations | 13 586 | 8% | 14 731 | 8% |
| Total | 128 025 | 77% | 128 005 | 72% |
A majority of R&D expenditure found in counties encompassing major metropolitan areas
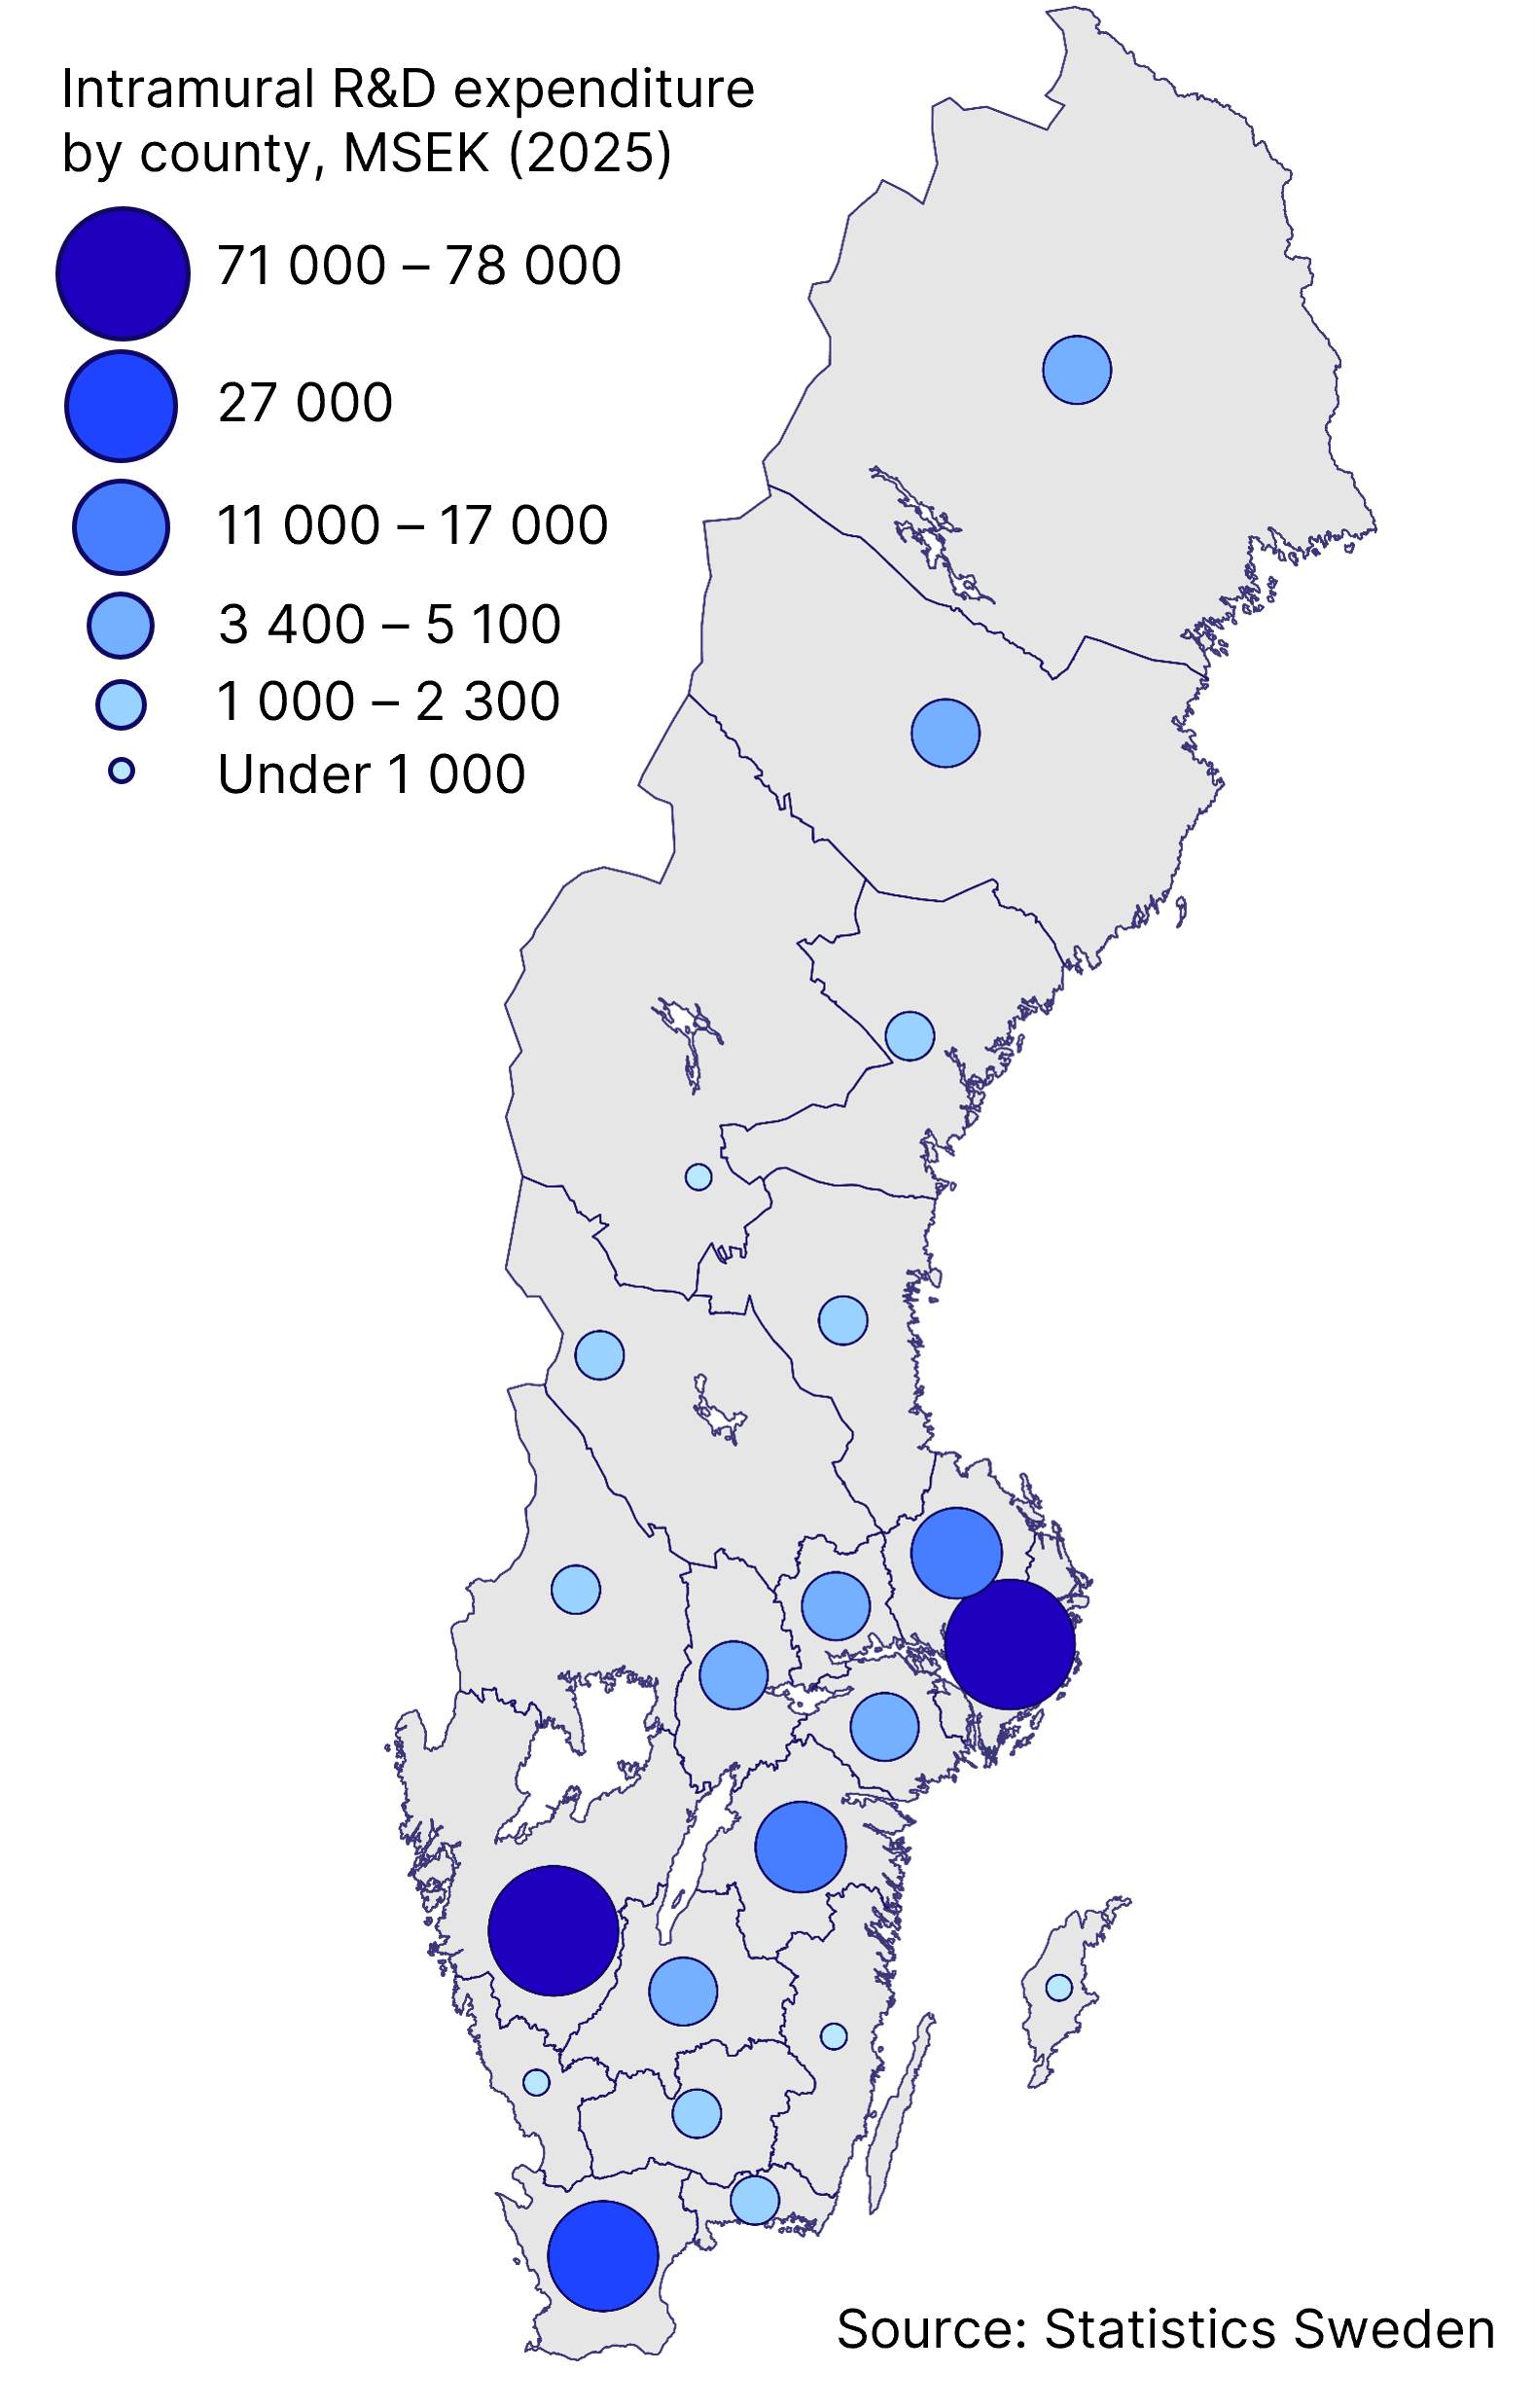
The three counties which encompass the major metropolitan areas (Stockholm, Västra Götaland and Skåne county) had the highest R&D expenditure. Together they made up almost 74 percent of the R&D in Sweden. Östergötland and Uppsala county were the only counties apart from the aforementioned three with R&D expenditures of at least SEK 10 billion. These five counties represented 85 percent of all R&D in Sweden.
In general, most of the R&D was performed in the southern part of Sweden, in particular in the Mälardal region (Stockholm, Uppsala, Södermanland, Västmanland and Örebro county), although both Norrbotten and Västerbotten county stand out with relatively higher R&D expenditure in the northern part of Sweden.
R&D expenditure higher in southern Sweden
Enterprises spend less on energy-related R&D
Since 2023 the questionnaire for the business enterprise sector contains a set of questions on their energy-related R&D. Between 2023 and 2025, R&D within the area fell from SEK 14.6 billion to SEK 13.8 billion. This can largely be attributed to changes in R&D directed at renewable energy sources, which fell by SEK 791 million. Energy efficiency, which made up the largest share of energy-related R&D in both 2023 and 2025, instead grew by SEK 180 million, which also means that its share of the area increased by 5 percentage points. Even though R&D in renewable energy sources was lower in 2025, it remained as the second largest area, followed closely by R&D in other energy-related technologies. Both nuclear fission and fusion, and fossil fuels increased slightly, SEK 85 million and SEK 88 million, respectively.
Significantly less R&D directed at renewable energy sources
| 2023 | 2025 | Change | ||||
|---|---|---|---|---|---|---|
| SEK Millions | Share | SEK Millions | Share | SEK Millions | Share | |
| Energy efficiency | 9 202 | 63% | 9 382 | 68% | 180 | 5% |
| Electric power | 1 358 | 9% | 1 226 | 9% | -132 | 0% |
| Fossil fuels | 151 | 1% | 239 | 2% | 88 | 1% |
| Hydrogen and fuel cells | 639 | 4% | 495 | 4% | -144 | -1% |
| Nuclear fission and fusion | 127 | 1% | 212 | 2% | 85 | 1% |
| Other energy related technologies | 842 | 6% | 747 | 5% | -95 | 0% |
| Renewable energy sources | 2 243 | 15% | 1 452 | 11% | -791 | -5% |
| Total | 14 562 | 100% | 13 753 | 100% | -809 | |
Updated standards for classification
For the reference year 2025 and onwards, statistics concerning the business enterprise sector has adjusted the industry classification and is reported according to SNI 2025 instead of SNI 2007. The change may impact the industry specific reporting. More information about SNI 2025 and how the reporting of statistics is impacted, can be found here:
Swedish Standard Industrial Classification (SNI)
Sveriges ekonomi december 2025 (in Swedish)
Within the higher education sector, the Swedish standard for classification of fields of research (SSIF) has been updated from the reference year 2025 and onwards. This may have some effect on detailed comparisons between fields of research and development. More information about SSIF 2025 and SSIF 2011 can be found here:
Standard för svensk indelning av forskningsämnen (in Swedish)
Definitions and explanations
Research and Development (R&D)
Research and experimental development (R&D) comprise creative and systematic work undertaken in order to increase the stock of knowledge and to devise new applications of available knowledge in all fields of science.
To be defined as R&D, an activity must be:
Novel: An R&D activity undertaken in order to generate new knowledge and to devise new applications of available knowledge.
Creative: R&D activities based on original concepts or hypotheses.
Uncertain: The final outcome of R&D activities is generally uncertain. There is also uncertainty related to the cost or time needed to achieve the expected results.
Systematic: R&D activities are performed systematically and are planned and budgeted.
Transferable and/or reproducible: An R&D activity should lead to results that could possibly be transferable and/or reproducible.
Intramural R&D
Activities carried out in Sweden by the organisation’s own personnel or by consultants in an R&D project led by the organisation, in the organisation’s own R&D activities. Intramural R&D also includes R&D carried out by commission.
Full-time equivalent in R&D
A full-time equivalent in R&D corresponds to the work a full-time employee performs over one year. A full-time employee who dedicates half their working time to R&D contributes with 0.5 full-time equivalents.
Fixed price calculation
Comparisons over time are presented in the 2025 price level to remove any price effects. For fixed price calculation, a GDP deflator based on the latest available statistics on GDP using the production approach, is calculated according to:
Deflator =(Nominal GDP/Fixed price GDP)*100
Sector reports
Reports concerning the individual sectors in detail will be published during the first two quartes of 2027.