Turnover in retail trade, April 2017:
Retail trade increased in April
Statistical news from Statistics Sweden 2017-05-30 9.30
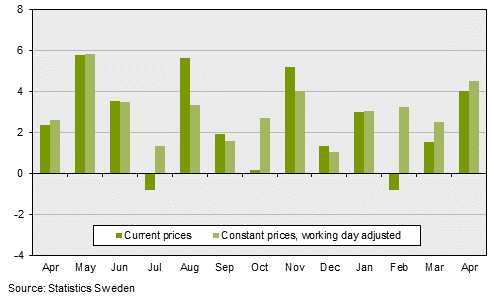
The retail trade sales volume increased by 4.5 percent in April compared with the same month last year. Retail sales in consumables increased by 3.2 percent, while retail sales in durables increased by 6.4 percent. This information is working-day adjusted.
The turnover in retail trade measured in current prices increased by 4.0 percent from April 2016 to April 2017. Retail trade in consumables (such as goods sold in department stores and specialised grocery stores) increased by 8.4 percent, while durables (such as clothing stores, furniture stores, second-hand goods stores and mail order houses) increased by 0.6 percent.
Retail trade increased by 1.3 percent between March 2017 and April 2017. In the last three-month period (February–April), sales increased by 0.9 percent compared with the previous three-month period (November–January). Both of these figures are expressed in constant prices, working-day and seasonally adjusted.
Comments by HUI Research:
The preliminary retail sales figure was about SEK 63 billion in April, corresponding to an increase of 4.0 percent in current prices compared with the same period last year. However, the growth is largely due to Easter taking place in April this year and in March last year.
Easter gives food sales a proper boost and this year was no exception. The preliminary sales growth for consumables was 8.4 percent, corresponding to just over SEK 2 billion in additional sales. In connection with the publication of the preliminary sales figures for April, the final estimate of the first quarter is carried out. The retail index is supplemented by administrative data from the Swedish Tax Agency, which means that the final estimate includes all retail companies. For consumables, this meant that the growth rate was adjusted upwards by 0.8 percentage points for the first quarter. The definitive growth rate is in line with HUI’s view of demand in the grocery trade, in terms of population growth and food price inflation.
At first glance, durable sales were weak in April, with a preliminary sales growth of 0.6 percent. This is mainly due to Easter being unfavourable to sales of durables, as households prioritise activities other than shopping. Nor did the weather favour the industry when April’s initial spring heat was followed by wind and snow, which probably reduced the desire to buy spring clothes. Nevertheless, some of the sub-sectors managed to increase during the month. These include pharmaceutical goods, furniture and sports.
Durables were also affected by the definitive estimate for the first quarter. Sales growth was adjusted upwards by 0.5 percentage points. Among the sub-industries, growth rates were adjusted upwards for electronics, clothing, furniture and sports, while shoes and home hardware were adjusted downwards.
Retail trade has started 2017 in line with HUI’s expectations. Consumables are struggling at a slow pace, driven by price increases and strong population growth. However, the competition from the restaurant sector and discount players means that the sales volume per capita remains around zero. Durables have begun the year somewhat weaker than expected. The high level of purchasing power and consumer confidence should result in a stronger outcome than has been demonstrated so far. HUI’s forecast for the full year 2017 is 3 percent for retail trade in total.
| okt% | nov% | dec% | jan% | feb% | mar% | |
|---|---|---|---|---|---|---|
EU |
4.0 | 4.1 | 2.5 | 1.8 | 2.7 | 2.7 |
Euro zone |
3.1 | 2.8 | 1.5 | 1.6 | 2.1 | 2.5 |
Sweden |
2.7 | 4.0 | 1.0 | 3.0 | 3.2 | 2.5 |
| Apr. | Maj. | Jun. | Jul. | Aug. | Sep. | Okt. | Nov. | Dec. | Jan. | Feb. | Mar. | Apr.^ | |
|---|---|---|---|---|---|---|---|---|---|---|---|---|---|
Turnover 2010=100 |
114.1 | 122.7 | 124.9 | 119.3 | 120.0 | 114.1 | 118.6 | 122.1 | 143.4 | 105.1 | 99.4 | 114.8 | 118.6 |
Monthly development %* |
2.4 | 5.8 | 3.5 | -0.8 | 5.6 | 1.9 | 0.2 | 5.2 | 1.3 | 3.0 | -0.8 | 1.5 | 4.0 |
3-month development %** |
5.2 | 4.4 | 3.9 | 2.8 | 2.7 | 2.2 | 2.5 | 2.4 | 2.1 | 3.0 | 1.2 | 1.3 | 1.7 |
12-month development %** |
5.7 | 5.9 | 5.6 | 4.7 | 4.9 | 4.5 | 4.0 | 3.8 | 3.4 | 3.3 | 2.7 | 2.4 | 2.5 |
| Apr. | May | Jun. | Jul. | Aug. | Sep. | Oct. | Nov. | Dec. | Jan. | Feb. | Mar. | Apr.^ | |
|---|---|---|---|---|---|---|---|---|---|---|---|---|---|
Turnover 2010=100 |
115.0 | 124.0 | 126.1 | 122.2 | 120.3 | 113.2 | 120.4 | 121.9 | 142.3 | 108.0 | 101.3 | 115.1 | 120.2 |
Monthly development %* |
2.6 | 5.8 | 3.5 | 1.3 | 3.3 | 1.6 | 2.7 | 4.0 | 1.0 | 3.0 | 3.2 | 2.5 | 4.5 |
3-month development %** |
2.7 | 3.4 | 4.0 | 3.5 | 2.7 | 2.1 | 2.5 | 2.8 | 2.5 | 2.6 | 2.3 | 2.9 | 3.4 |
12-month development %** |
4.5 | 4.6 | 4.4 | 3.9 | 3.9 | 3.6 | 3.4 | 3.2 | 2.9 | 2.9 | 2.8 | 2.9 | 3.0 |
| Apr. | May | Jun. | Jul. | Aug. | Sep. | Oct. | Nov. | Dec. | Jan. | Feb. | Mar. | Apr.^ | |
|---|---|---|---|---|---|---|---|---|---|---|---|---|---|
|
Turnover 2010=100
|
116.8 | 120.1 | 118.4 | 117.8 | 118.7 | 118.4 | 119.4 | 121.4 | 118.1 | 120.4 | 120.8 | 120.4 | 122.0 |
|
Development %***
|
-0.2 | 2.8 | -1.4 | -0.5 | 0.7 | -0.3 | 0.9 | 1.7 | -2.7 | 1.9 | 0.3 | -0.3 | 1.3 |
|
Development for the latest 3 month %****
|
0.1 | 0.9 | 1.2 | 1.5 | 0.3 | -0.1 | 0.0 | 1.2 | 1.1 | 1.0 | 0.1 | 0.8 | 0.9 |
|
Development for the latest 6 month %****
|
1.4 | 1.4 | 1.4 | 1.3 | 1.2 | 1.3 | 1.6 | 1.3 | 1.0 | 1.3 | 1.4 | 1.5 | 1.5 |
1 The true change is with 95 percent probability covered by the estimated interval.
2 The period of January up to and including the given month compared with the same period last year.
3The working day effect shows basic conditions for sales in the period of the present year compared with last year.
A working day effect of 1.0 percent negatively affects the sales development by 1.0 percentage points.
^ The given month's results are preliminary.
* Comparison with same month last year.
** Comparison between the latest 3- or 12-month period and the same period of last year.
*** Comparison with last month (only for seasonally adjusted series).
**** Latest 3- or 6-month period compared with the most recent previous 3- or 6-month period (seasonally adjusted series).
Definitions and explanations
Total retail trade refers to NACE 47 excluding 47.3.
Trade in consumables here refers to NACE 47.11 and 47.2.
Durables here refer to NACE 47.19 and 47.4-47.7.
All time series use the year prior to the year of the survey as their base year. Contact HUI Research for more detailed reports of the retail trade activities.
Revisions
When the Retail Trade Index is published for a new month, the index for previous months is also revised if new information has been added. From April 2015, a new method to calculate definitive statistics was introduced. The new method entails primarily that administrative data from the Swedish Tax Agency is used quarterly to increase the number of companies that are investigated and reduce the burden of the companies to contribute data. This means that definitive quarterly statistics are based on a calculation for all the companies in the population. The reason to use administrative data every quarter is to improve the quality of the retail trade index. Usually the material is revised between two and four months backwards depending on where in the quarter the reference month is. In connection with the publication of the first and second month in a quarter the entire previous quarter is revised. The series, corrected for calendar and seasonal effects and trend estimates is always revised from January 1991 and forward. Information regarding major revisions will be published at www.scb.se/ha0101.
More information:
Enquiries about the Retail Trade Index should be referred to Jonas Arnberg at HUI Research +46 8 762 72 89.
Next publishing will be
Data for May will be published on 29 June at 09:30.
Statistical Database
More information is available in the Statistical Database
Feel free to use the facts from this statistical news but remember to state Source: Statistics Sweden.