Environmental Accounts – Emissions to air second quarter 2022
Greenhouse gas emissions from Swedish air transport increase in the second quarter of 2022
Statistical news from Statistics Sweden 2022-10-27 8.00
Greenhouse gas emissions from Swedish air transport increase by 140 percent in the second quarter of 2022 compared with the same quarter in 2021. This increase is a rebound from earlier decreases during the covid-19 pandemic. Air transport’s emissions are still lower that the pre-pandemic level.
- The effect of the coronavirus pandemic on Swedish air transport’s greenhouse gas emissions is wearing off in the second quarter of 2022. Swedish air transport emissions are still 14 percent below emissions in the same quarter of 2019, explains Axel Ehrling, analyst at Statistics Sweden environmental accounts.
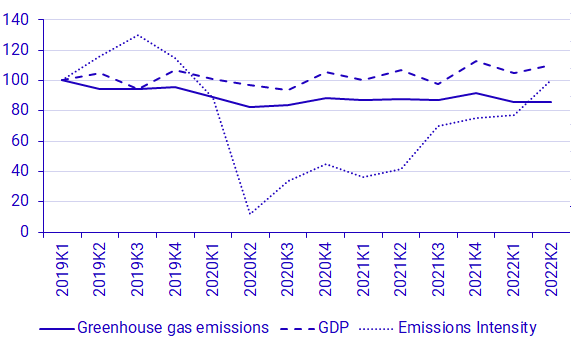
Source: Statistics Sweden.
Changes in the second quarter 2022 in brief
The percentage changes below are compared with the corresponding quarter in the previous year, unless otherwise stated. Greenhouse gas emissions are measured in carbon dioxide equivalents.
- Emissions from the Swedish economy decrease by 2 percent in the second quarter of 2022 to 11,9 million tons of carbon dioxide equivalent, while GDP increases by 3 percent.
- Emissions from the transport industry overall increase by 267 kt, of which the air transport sector increases its emissions by 300 kt, i.e. more than the industry as a whole.
- Emissions from private consumption decrease by 9 percent, which is a decrease of 204 kt. 152 kt are as a result of reduced diesel consumption in private transport.
- The agriculture, forestry and fishing industry as well as the construction industry reduce their emissions by 70 and 76 kt, respectively, which corresponds to a reduction of 3 and 17 percent, respectively.
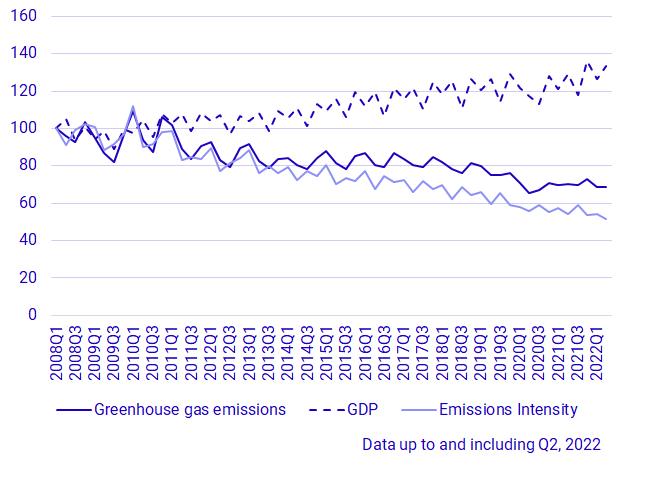
Source: Statistics Sweden.
| NACE 2007 industry | Greenhouse gas emissions | Value added | |||||
|---|---|---|---|---|---|---|---|
| 2022Q2 | Change compared with same quarter 2021 | 2022Q2 | Change compared with same quarter 2021 | ||||
| Agriculture, forestry and fishery | 2 113 | ‑70 | ‑3.2% | 19 400 | ‑280 | ‑1.4% | |
| Mining | 201 | ‑4 | ‑2.2% | 11 570 | ‑65 | ‑0.6% | |
| Manufacturing | 3 475 | ‑65 | ‑1.8% | 170 310 | 684 | 0.4% | |
| Electricity, gas, heat, water, waste | 1 508 | ‑14 | ‑0.9% | 41 336 | 1 988 | 5.1% | |
| Construction | 374 | ‑76 | ‑16.9% | 97 681 | 2 421 | 2.5% | |
| Transport | 1 498 | 267 | 21.6% | 47 537 | 4 094 | 9.4% | |
| Other services | 715 | ‑94 | ‑11.6% | 630 294 | 40 949 | 6.9% | |
| Public sector | 88 | ‑9 | ‑9.0% | 251 964 | ‑2 199 | ‑0.9% | |
| Households and non-profit institutions1 | 1 976 | ‑204 | ‑9.4% | 16 499 | 755 | 4.8% | |
| Total economy2 | 11 948 | ‑270 | ‑2.2% | 1 442 164 | 47 182 | 3.4% | |
[1] Only non-profit institutions provide value added. [2] GDP with a production approach.
Source: Statistics Sweden
Definitions and explanations
What do the quarterly statistics show?
The quarterly statistics from Statistics Sweden's environmental accounts report production-based emissions to air per industry from the Swedish economy, which also includes households. Production-based emissions are emissions of greenhouse gases by Swedish economic actors. The statistics include the emissions from Swedish companies and individuals that occur both outside and inside Sweden's borders. Production-based emissions use the same system boundary as for the national economic statistics, i.e. the national accounts.
For the air transport industry, emissions arising from airlines with economic residence in Sweden are included, regardless of where in the world these emissions occur. Emissions from foreign airlines flying to, from or within Sweden are not included.
Revisions
For the second quarter of 2022, the OECD time series on carbon dioxide emissions from aviation has been used for the entire time series 2008-2022Q2, for more information see: oecd.org.
In the previous production round, the emissions from 2021Q1 onward had been calculated using data from the monthly fuel statistics survey.
This revision has led to a changed in absolute emissions from the aviation industry. Previously published data therefore show 175 kt CO2 eq higher emissions for the aviation in the whole year 2021, as well as a different quarterly distribution of the emissions.
Greenhouse gas emissions from D35 – E39 energy, water, sewage and waste sector, are revised down for the time period 2022 Q1 by 140 kt compared to the previous publication, due to updated data on fuel consumption in the energy sector.
For this publication, greenhouse gas emissions from C19-21, the manufacturing of coal products, refined petroleum, chemical and chemical products as well as pharmaceutical base products and pharmaceuticals sectors, are between 54 and 68 kilotons of carbon dioxide equivalent higher for the time periods 2021Q1 – 2022Q1 than in the last publication thanks to new data from the EU ETS.
More information about emissions accounting is available on the Statistics Sweden’s website (in Swedish): Dokumentation.
Next publishing will be
The next statistical news on quarterly emissions to air for the third quarter of 2022, is scheduled for 2nd February 2023.
Statistical Database
More information is available in the Statistical Database
Feel free to use the facts from this statistical news but remember to state Source: Statistics Sweden.