Environmental accounts – Emissions to air 2016:
Manufacturing and transport industries remain largest sources of greenhouse gas emissions
Statistical news from Statistics Sweden 2018-03-27 9.30
In the past three years, total greenhouse gas emissions have been levelling out. The largest emissions stem from the manufacturing industry and the transport industry, which includes road, sea and air transport. This, according to new final statistics on emissions from Statistics Sweden’s Environmental Accounts.
The downward trend in the electricity, gas and heat industry was interrupted in 2016, as greenhouse gas emissions increased by 6 percent in this industry. Emissions by the transport industry increased by 5 percent. Emissions decreased in other economic activities and households.
Final annual statistics on the 2016 air emissions are now available. Greenhouse gas emissions by the Swedish economy in 2016 amounted to 62 million tonnes of carbon dioxide equivalents, which is largely unchanged from the previous year. Since the time series started in 2008, emissions have decreased by 14 percent, and have remained largely unchanged in the past three years.
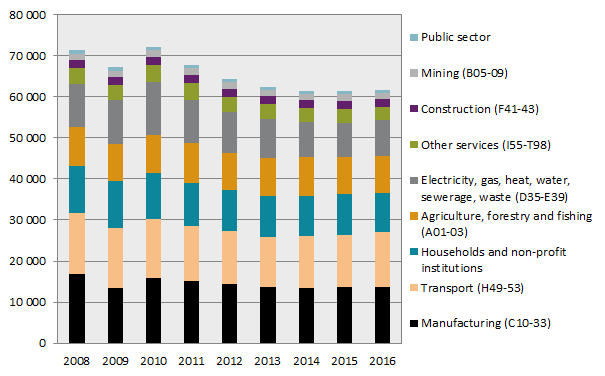
Greenhouse gas emissions by the transport industry increased by about 5 percent between 2015 and 2016. The sea transport industry is the largest contributor to emissions in the transport industry and account for over 54 percent. Emissions in this industry increased by about 9 percent between 2015 and 2016. However, in the same period, the largest increase in emissions, 15 percent, was by the aviation industry. The land transport industry decreased its emissions of greenhouse gases by 10 percent.
In the past two years (2014–2015), greenhouse gas emissions by the electricity, gas and heating industry have had a decreasing trend. However, emissions rose again in 2016 by about 6 percent compared with 2015. An explanation for this increase is an increased production during the year, and the fact that large parts of Sweden experienced a cold and dry year in 2016.
Emissions decreased in many industries. In the service industry, emissions decreased by 5 percent, largely due to reduced use of fossil fuels. Instead, use of bio fuels has increased. Other economic activities in which greenhouse gas emissions have decreased include construction, public sector, mining and quarrying. Emissions by the agriculture, forestry and fishery industries have remained largely unchanging compared with 2015.
Households keep reducing greenhouse gas emissions
Greenhouse gas emissions by households continue to decrease. Between 2015 and 2016, emissions decreased by 3 percent. Households is the third largest group affecting emission levels, mainly through heating and fuels for transport. This drop in emissions is explained by reduced use of fossil fuels in vehicles and for heating. Instead, the use of biofuels for household transports is increasing, while it remains the same for heating.
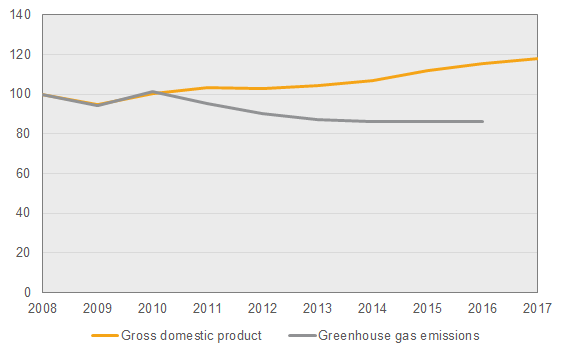
GDP increases while emissions are levelling out
Sweden’s economy is increasing; between 2008-2017, it rose by nearly 20 percent. Greenhouse gas emissions followed the economic trend between 2008–2010, but subsequently decreased. In recent years, between 2014 and 2016, the development is levelling out.
Biofuel use gradually increasing
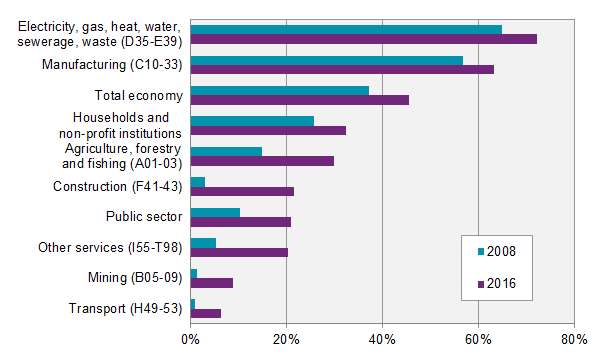
The use of biomass as fuel has increased in Sweden from 37 percent in 2008 to 45 percent in 2016. The total amount of used fossil- and biofuels decreased slightly in the same period, while the amount of biofuels increased.
The use of biofuels increased in all industries. The largest share of biofuels, that is, the consumption of biofuels in relation to the total fuel consumption (fossil + biogenic) by each industry, is used by electricity, gas and district heating plants and by manufacturing industries. These industries also account for the largest use of biofuels in total.
Update of environmental-economic profile in autumn 2018
Statistic Sweden’s Environmental Accounts also reports various industries’ emissions in relation to the employment rate and value added (the industries’ contribution to GDP). However, the statistics concerning annual air emissions are prepared before the annual statistics on the employment rate and value added. Therefore, emission intensities and environmental-economic profiles will be updated in the autumn, when this data becomes available for 2016.
Use the analytical tool for environmental economic data
The Environmental Accounts data is available using the analytical tool online that combines data from the Environmental Accounts and economic data, where emission statistics from both a production and a consumption perspective can be analysed further together with environmental-economic instruments. The analytical tool is available on the Environmental Accounts’ webpage:
System of Environmental and Economic Accounts
It can be used to compare industries and study the relationship between demand in the economy, energy use and emissions of various substances.
Definitions and explanations
The Environmental Accounts present national environmental statistics and economic statistics in the same framework using NACE industry classification. Environmentally-related statistics connected to the system of national accounts enable an analysis between the economy and the environment. The starting point is Swedish economic actors’ environmental impact, regardless of where in the world the emissions occur. Emissions from international bunkers, that is, international aviation and navigation arriving and refuelling at Swedish airports and harbours are included as an approximation of Swedish companies’ emissions from international aviation and shipping. Emissions and removals from land use and land use change (LULUCF) and carbon capture and storage (CCS) are not included.
These statistics on air emissions are based on a production perspective. Emissions are reported for the industry where emissions occur. Indirect emissions from imports and other consumption of goods and services are not included.
Since the last publishing, there have been a number of revisions for 2008–2015, due to updated statistics and some minor development of the methodology. More information (in Swedish) on this is available at:
System of Environmental and Economic Accounts under Documentation.
Next publishing will be
The next statistical news on quarterly emissions to air up to the fourth quarter of 2017 is scheduled for publication on 2018-05-08 at 09:30. Preliminary annual statistics for 2017 will be published at the same time.
The next statistical news on annual emissions to air, 2008–2017 (final statistics) is scheduled for publication in spring 2019.
Statistical Database
More information is available in the Statistical Database
Feel free to use the facts from this statistical news but remember to state Source: Statistics Sweden.