Environmental accounts – Emissions to air Q2 2017:
Emissions from manufacturing industry decrease
Statistical news from Statistics Sweden 2017-10-26 9.30
The emissions from greenhouse gas emissions from the manufacturing industry and the emissions from households’ passenger cars is decreasing during the second quarter of 2017. The total emissions of greenhouse gas emissions from the Swedish economy including households continues to increase the second quarter of 2017. The increase is mainly due to increased emissions from international shipping and the electricity, gas and heating industry. At the same time the Swedish economy continues to grow.
The Environmental Accounts at Statistics Sweden presents quarterly production-based emissions, that is, emissions to air from the Swedish economy.
In the second quarter of 2017, greenhouse gas emissions from the Swedish economy and households amounted to 15.6 million tonnes of carbon dioxide equivalents. This is an increase of 2.8 percent compared with the same quarter in 2016. In the same period, economic growth was 1.5 percent.
For territorial greenhouse gas emissions, used for monitoring national climate objectives, total emissions in the second quarter of 2017 amounted to 13.0 million tonnes of carbon dioxide equivalents, equal to the same quarter of 2016. See also Swedish EPA website (in Swedish).
More information (in Swedish) about different ways to calculate emissions
Detailed information on environmental accounts:
Statistics on emissions of greenhouse gases and air pollution (pdf)
The Swedish Environmental Protection Agency:
Three ways of calculating emissions that affect the climate
There are several driving forces behind the increased emissions in the second quarter of 2017. The most important reason is that emissions from the transport industry (NACE 49-53) increased by 14 percent, mostly related to international shipping. Also emissions from electricity, gas, heating, water and waste (NACE 35-39) increased by 3.7 percent. Temperatures were lower in the second quarter 2017 compared to same quarter 2016 thus increasing the need for heating.
Emissions from households, mainly from passenger cars, decreased by 2.0 percent in the second quarter of 2017 compared with the same quarter in 2016. The continued decrease in emissions from households is due to a change in the use of different fuel types. The use of gasoline, still an important fuel, and ethanol decreased, while the use of fossil and biogenic diesel increased. Emissions from manufacturing industries decreased by 3.5 percent due to decreased production.
Economic growth in the second quarter of 2017 varies for different industries. Value added increased most in construction (NACE 41-43), but also within various services, manufacture of motor vehicles (NACE 29) and trade (NACE 45-47). The largest decrease in value added appeared in the public sector, education (NACE 85), residential care and social work (NACE 87-88), refining and chemicals etc (NACE 19-21) samt transport (NACE 49-53).
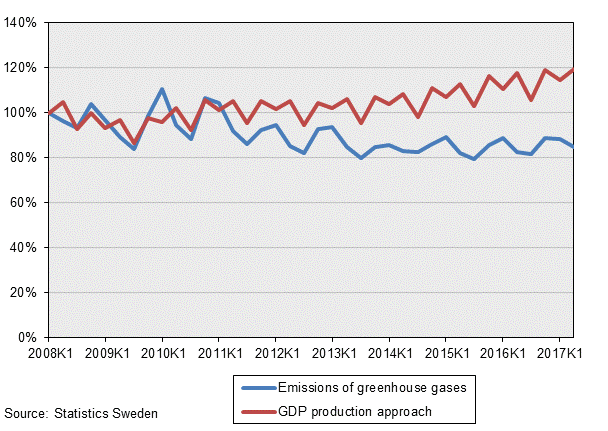
Source: Statistics Sweden, Environmental accounts and national accounts
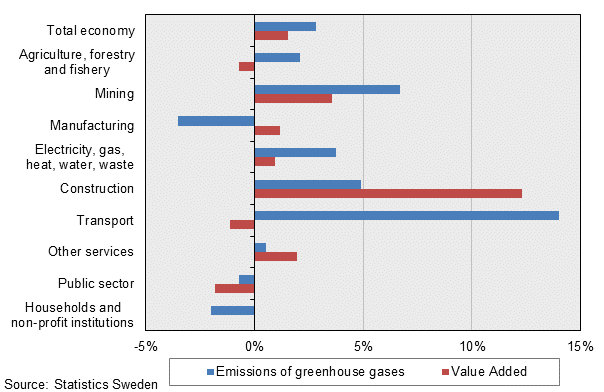
Source: Statistics Sweden, Environmental accounts and national accounts
Revisions
Since the previous publication on 2017-08-30, the following revisions have been made for quarters from 2008Q1 to 2017Q1:
- Updated distribution model for emissions from rodad trafffic affects emissions for all NACE industries 2015-2017. Changes in absolute values are very small for all NACE industries, but for some NACE industriues with small emissions the impact is significant by per cent.
- Minor updates NACE B05-C35 2017Q1 due to updates in Quarterly fuel statistics.
More information (in Swedish) on the revisions is available at the Environmental Accounts’ product page under Documentation.
Developments in different industries
The connection between emissions of greenhouse gases and industry’s contribution to the Swedish economy varies between industries, due to the different types of activities in each industry. Some industries are emissions-intensive, and increased production means higher emissions, while other industries may increase value added without any significant increase in emissions levels.
| Sector | Emissions of greenhouse gases | Value added | |||||
|---|---|---|---|---|---|---|---|
| 2017Q2 | Change compared to same quarter 2016 | 2017Q2 | Change compared to same quarter 2016 | ||||
| Agriculture, forestry and fishing | 2 287 | 46 | 2.1% | 13 951 | ‑99 | ‑0.7% | |
| Mining | 346 | 22 | 6.7% | 4 196 | 145 | 3.6% | |
| Manufacturing | 3 548 | ‑129 | ‑3.5% | 153 563 | 1 783 | 1.2% | |
| Electricity, gas, heat, water, waste | 1 871 | 68 | 3.7% | 26 439 | 249 | 1.0% | |
| Construction | 485 | 23 | 4.9% | 75 008 | 8 218 | 12.3% | |
| Transport | 3 604 | 443 | 14.0% | 41 714 | ‑485 | ‑1.1% | |
| Other services | 836 | 4 | 0.5% | 495 615 | 9 531 | 2.0% | |
| Public sector | 178 | ‑1 | ‑0.7% | 202 497 | ‑3 731 | ‑1.8% | |
| Households and non-profit institutions [1] | 2 412 | ‑50 | ‑2.0% | 14 017 | 47 | 0.3% | |
| Total economy | 15 566[2] | 425 | 2.8% | 1 027 000 | 15 658 | 1.5% | |
[1] Only non-profit institutions provide value added. [2] For territorial greenhouse gas emissions, used for monitoring national climate objectives, total emissions in the second quarter of 2017 amounted to 13.0 million tonnes of carbon dioxide equivalents, equal to the same quarter of 2016. See also the Swedish EPA website.
Agriculture, forestry and fishing
Agriculture, forestry and fishing accounted for 15 percent of total greenhouse gas emissions. Most greenhouse gases emitted in this sector (around 90 percent) come from agriculture. Emissions of greenhouse gases increased by 2.1 percent in the second quarter compared with the same quarter of 2016. Forestry accounts for more than 70 percent of value added in this sector. Value added in the whole sector decreased by 0.7 percent in the second quarter of 2017 compared with the same quarter of 2016.
Mining
Emissions from mining account for 2 percent of all emissions in the Swedish economy and households. Emissions increased by 6.7 percent in the second quarter compared with the same quarter of 2016. Value added increased by 3.6 percent in the second quarter of 2017compared with the same quarter of 2016.
Manufacturing
Manufacturing accounts for 23 percent of total greenhouse gas emissions in the Swedish economy and households. Greenhouse gas emissions decreased by 3.5 percent in the second quarter of 2017 compared with the same quarter of 2016. In the period, value added increased by 1.2 percent. Industries that contribute the most to greenhouse gas emissions are steel, metal, chemicals production, refineries and cement production. The most significant decrease in emissions was within refineries and manufacturing of chemicals due to decreased production.
Electricity, gas, heat, water and waste
Greenhouse gas emissions in this sector annually account for 12 percent of total emissions of greenhouse gases from the Swedish economy and households. Most emissions of greenhouse gases (65 to 85 percent each quarter) come from electricity and heat production. Emissions levels in the second quarter of 2017 were 3.7 percent higher than in the same quarter of 2016. Temperatures were lower than in the same quarter in 2016, thus increaseing the need for heating. In the period, value added increased by 1.0 percent.
Construction
Model-estimated greenhouse gas emissions in this sector account for 3 percent of total greenhouse gas emissions in the Swedish economy and households. Emissions arise mainly from transport, machinery and industrial vehicles. In the second quarter of 2017, emissions increased by 4.9 percent, while value added increased by 12.3 percent compared with the same period in 2016.
Transport
Greenhouse gas emissions in the transport industry account for 23 percent of total emissions in the Swedish economy and households. Emissions increased by 14.0 percent in the second quarter in 2017 compared with the same quarter in 2016. Emissions come mainly from maritime traffic, but the increase in the second quarter is from both maritime traffic, aviation and land transport. Value added decreased by 1.1 percent in the second quarter of 2017 compared with the same quarter of 2016.
Other services
Greenhouse gas emissions in other services account for 5 percent of total emissions in the Swedish economy and households. Emissions in these industries are relatively small compared to value added and are mainly due to road transports. In the second quarter of 2017, emissions increased by 0.5 percent, while value added increased by 2.0 percent compared with the same quarter in 2016.
Public sector
Greenhouse gas emissions in the public sector (central government, county and municipality) account for about 1 percent of total emissions in the Swedish economy and households. Emissions arise mainly from working machinery, road transports and military activities. Emissions decreased by 0.7 percent in the second quarter of 2017 compared with the same quarter in 2016. Value added decreased by 1.8 percent in the same period.
Households and non-profit institutions
Greenhouse gas emissions from households and non-profit institutions account for 15 percent of total emissions in the Swedish economy and households. Emissions arise mainly from households’ passenger car transport. Changes in fuels used is an important driving force for emissions: Use of gasoline, still an important fuel, and ethanol is decreasing. At the same time, use of fossil diesel and biodiesel are increasing in this sector. Taken together, this results in decreased emissions by 2.0 percent in the second quarter of 2017compared with the same quarter in 2016. Only non-profit institutions contribute with a small level of value added
Definitions and explanations
The Environmental Accounts are compiled within the framework of the System of Environmental and Economic Accounts (SEEA) and present national environmental statistics and economic statistics in the same framework, using NACE industry classification. Environmentally-related statistics connected to the system of national accounts enable an analysis of the Swedish economy and the impact that each industry has on the environment.
Emissions to air according environmental accounts is based on a production perspective and defined by the nationality of economic actors. Direct emissions from Swedish economic actors are included, regardless of where in the world emissions occur. This is called the residence principle and includes three parts:
- Emissions within the Swedish territory
- Deduct emissions from aviation, navigation and land transport from foreign economic actors in Sweden
- Add emissions from aviation, navigation and land transport from Swedish economic actors abroad
As an approximation, the environmental accounts residence adjustment currently includes emissions from international bunkers, that is, international aviation and navigation arriving and refuelling at Swedish airports and harbours. A simplified assumption is thus made that emissions from foreign land transports in Sweden are equal to emissions from Swedish land transports abroad and that emissions related to what Swedish ships and planes bunker abroad are equal to emissions related to what foreign ships and planes bunker in Sweden.
Indirect emissions from imports and other consumption of goods and services are not included. Emissions and removals from land use and land use change (LULUCF) and carbon capture and storage (CCS) are not included.
Annual Environmental Accounts on emissions to air by industry currently has a production time of 15 months. There is a demand for more up-to-date statistics on emissions to air of greenhouse gases. To meet this need, Environmental Accounts at Statistics Sweden has developed quarterly statistics on emissions to air by industry that was also used to produce preliminary annual statistics.
Quarterly statistics on all greenhouse gases and a number of air pollutants are available in Sweden’s Statistical Database. Excel spread sheets are also available for download on Statistics Sweden’s website, and include data and figures on greenhouse gas emissions and emissions intensities by value added and by employees.
Statistics on emissions to air provided by the Swedish Environmental Protection Agency (EPA) follow the UNFCCC framework, covering emissions within Sweden’s territory. Sectors are listed by emissions category, not by industry. Emissions and removals from land use and land use change are included, while emissions from international aviation and navigation are reported separately.
The Swedish Environmental Protection Agency’s statistics on emissions to air:
Statistics on emissions to air (in Swedish)
More information (in Swedish) about different ways to calculate emissions
Detailed information on environmental accounts:
Statistics on emissions of greenhouse gases and air pollution (pdf) (in Swedish)
The Swedish Environmental Protection Agency:
Three ways of calculating emissions that affect the climate (in Swedish)
Next publishing will be
The next statistical news on quarterly emissions to air up to and including the third quarter of 2017 is scheduled for publication on 2018-01-31 at 09:30.
The next statistical news on regional emissions to air up to and including 2015 is scheduled for publication on 2017-11-09 at 09:30.
The next statistical news on annual emissions to air 2008–2016 (final statistics) is scheduled for publication on 2018-03-27 at 09.30.
Statistical Database
More information is available in the Statistical Database
Feel free to use the facts from this statistical news but remember to state Source: Statistics Sweden.