Environmental Accounts – Emissions to air Q2 2020
Greenhouse gas emissions from transport sector dropped sharply in the second quarter of 2020
Statistical news from Statistics Sweden 2020-10-29 9.30
Greenhouse gas emissions from Sweden’s economy decreased by 11 percent in the second quarter of 2020 compared with the same quarter in 2019. This decrease is mainly due to falling emissions from the transport sector, including air transport and water transport, and households.
Greenhouse gas emissions from the Swedish economy amounted to 12.1 million tonnes of carbon dioxide equivalent in the second quarter of 2020. This is 11.2 percent less than the same period in 2019. In the same interval, Sweden’s GDP decreased by 7.3 percent. This means the trend of declining greenhouse gas emissions per Swedish krona of production in the economy (the emissions intensity) has continued.
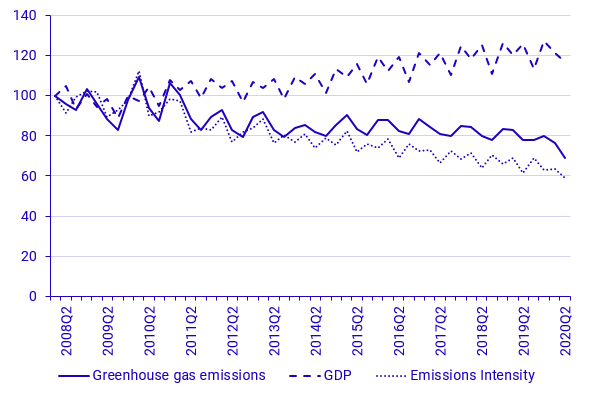
Source: Statistics Sweden
Emissions statistics are produced later than quarterly GDP statistics. Therefore, GDP and greenhouse gas emissions are compared only up to the first quarter of 2020. GDP for the second quarter of 2020 (published on 28 August) shows a decrease of 7.3 percent.
Emissions decreased in most sectors
Greenhouse gas emissions declined in most sectors in the second quarter of 2020 compared with the same period in 2019. This decrease is mainly due to less travel in the second quarter of 2020. For 2020, emissions from mobile sources were modelled using the method described below.
The largest decrease was noted in the transport sector and in households. In the transport sector, emissions fell by 45 percent in the second quarter of 2020 compared with the same period in 2019. This decrease was mainly noted in air transport, although it was also apparent in water transport. Value added in the transport sector decreased by 25 percent.
Households’ greenhouse gas emissions decreased by 15 percent in the second quarter of 2020 compared with the same period in 2019. This decrease was due to reduced travel in passenger cars. Greenhouse gas emissions from manufacturing decreased by 4 percent in the second quarter of 2020 compared with the same period in 2019. This decrease mainly came from steel and metal production. Value added in manufacturing decreased by 21 percent over the same period.
Greenhouse gas emissions from energy, wastewater and waste utilities increased in the second quarter of 2020 compared with the same period in 2019. In the same period, greenhouse gas emissions from the mining sector also increased marginally. The increased emissions in energy, wastewater and waste utilities in the second quarter of 2020 are in part due to less activity in the energy sector in the second quarter of 2019.

Source: Statistics Sweden
| NACE 2007 industry | Greenhouse gas emissions | Value Added | |||||
|---|---|---|---|---|---|---|---|
| 2020Q2 | Change compared to samer quarter 2019 | 2020Q2 | Change compared to same quarter 2019 | ||||
| Agriculture, forestry and fishery | 2 154 | ‑35 | ‑1.6% | 18 652 | ‑947 | ‑4.8% | |
| Mining | 274 | 2 | 0.6% | 7 752 | ‑42 | ‑0.5% | |
| Manufacturing | 3 541 | ‑163 | ‑4.4% | 130 894 | ‑34 689 | ‑20.9% | |
| Electricity, gas, heat, water, waste | 1 513 | 196 | 14.9% | 29 770 | ‑699 | ‑2.3% | |
| Construction | 465 | ‑9 | ‑1.9% | 88 065 | 920 | 1.1% | |
| Transport | 1 328 | ‑1 078 | ‑44.8% | 35 102 | ‑11 783 | ‑25.1% | |
| Other services | 793 | ‑79 | ‑9.0% | 514 955 | ‑34 578 | ‑6.3% | |
| Public sector | 123 | ‑29 | ‑19.0% | 225 879 | ‑6 662 | ‑2.9% | |
| Households and non-profit institutions [1] | 1 922 | ‑338 | ‑15.0% | 14 252 | ‑1 240 | ‑8.0% | |
| Total economy | 12 113 | ‑1 533 | ‑11.2% | 1 204 085 | ‑94 882 | ‑7.3% | |
[1] Only non-profit institutions provide value added. Source: Statistics Sweden
Revisions
For the reference periods first quarter 2008 up to and including the fourth quarter 2017, the statistics produced here used the monthly fuel, gas and inventory statistics as a source in calculating quarterly emissions from transport vehicles. For reference periods starting with and including first quarter 2018, other sources have been used. These sources included the register of reports to the Swedish Energy Agency in accordance with Sweden’s implementation of the EU’s Renewable Energy Directive (2009/28/EC) and other relevant physical data with short periodicity (more information is available in the Swedish quality declaration for the statistics here). The reason for this methodological development is that the monthly fuel, gas and inventory statistics have been deemed to be associated with significant uncertainties from the start of reference year 2018. These uncertainties are considered to have arisen due to a revision of the data collection survey used for the monthly fuel, gas and inventory statistics that was implemented at the start of 2018.
In accordance with this development, the following sources have been used to calculate emissions from transport vehicles for the second quarter of 2020:
- For water transport: The quarterly development of the number of vessels docking in Swedish ports (in gross tonnage) between the years, according to Sweden’s official statistics on shipping goods (from Transport Analysis, Trafikanalys)
- For aviation: The quarterly development of the number of landings at Swedish airports (from the Swedish Transport Agency, Transportstyrelsen)
- For heavy goods (road) vehicles: The quarterly development of transport work (in tonne-km) according to Sweden’s official statistics on road goods transport (from Transport Analysis, Trafikanalys)
- For passenger cars: The development of weekly changes in traffic volume on the state road network (from the Swedish Transport Administration, Trafikverket)
Emissions from mobile sources amount to almost 45 percent of the total, which should be taken into account when interpreting the data presented. Greenhouse gas emissions from mobile sources decreased by about 24 percent in total in the second quarter of 2020 compared with the same period in 2019.
Several activities are underway to improve the statistics to make it possible to return to earlier methods.
Definitions and explanations
The System of Environmental Economic Accounting (SEEA) is constructed using the national accounts as a foundation and presents environmental and economic statistics in a common system. The SEEA makes it possible to analyse interactions between the economy and the environment. The starting point is Swedish economic actors’ environmental pressures, irrespective of where in the world they occur.
A residence adjustment is therefore applied to adjust statistical sources with a territorial perspective used to produce these statistics to the national and environmental accounts’ economic perspective. The residence adjustment applies primarily to transport: heavy duty road transport (primarily within H49 land transport companies, but also other industries, such as construction), maritime transport (H50) and aviation (H51). The residence adjustment for heavy duty road transport is based on data on transport work (in tonne-km) for Swedish companies abroad and foreign companies in Sweden, with data from Transport Analysis (Trafikanalys). For maritime transport and aviation, the residence adjustment is based on data for Swedish companies’ expenditure on fuel from Statistics Sweden’s National Accounts database on intermediate use in the economy, PRIOR.
Emissions and sequestration due to land use (LULUCF) and carbon dioxide capture and storage (CCS) are not included in the statistics.
The statistics produced here use a production perspective. This means that emissions are allocated to the actor and sector that produces the emissions. Indirect emissions arising due to imports and other consumption are not included.
The statistics produced here are not used directly to measure emissions in relation to nationally and internationally agreed climate targets. Statistics with a territorial perspective are used for that purpose. More information about different perspectives for emissions accounting is available on the Swedish Environmental Protection Agency’s website (in Swedish):
Next publishing will be
The next statistical news, on quarterly emissions to air in the third quarter of 2020, is scheduled for publication in January 2021.
Statistical Database
More information is available in the Statistical Database
Feel free to use the facts from this statistical news but remember to state Source: Statistics Sweden.