Environmental Accounts – Emissions to air Q3 2019
Greenhouse gas emission intensity decreased by 1 percent in the third quarter of 2019
Statistical news from Statistics Sweden 2020-01-30 9.30
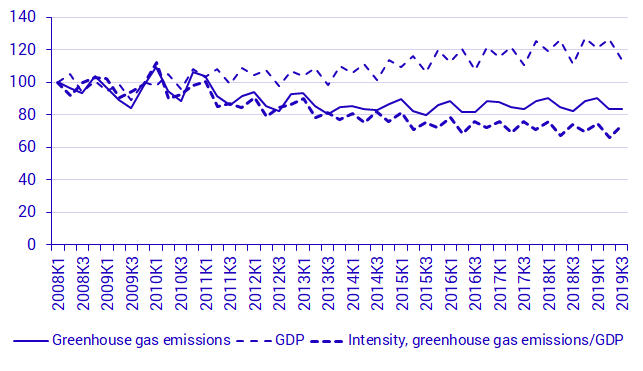
The greenhouse gas emissions intensity of the Swedish economy in the third quarter of 2019 was 13.5 kg carbon dioxide equivalents per thousand Swedish krona of GDP – a reduction of 1 percent compared with the same period in 2018.
This reduction is largely due to a 2.0 percent growth in GDP in the third quarter of 2019 compared with the same period in 2018 and in spite of a 1.3 percent rise in greenhouse gas emissions in the same period.
Trend toward decreasing intensity reductions continues
In the third quarter of 2019, the trend toward decreasing reductions in the economy’s greenhouse gas intensity continued. Between 2016 and 2019, the average intensity reduction for the third quarter amounted to 1 percent. By comparison, between 2013 and 2016, the average reduction for the third quarter was 3 percent.

Source: Statistics Sweden
Lower greenhouse gas emissions from electricity, gas and heat supply
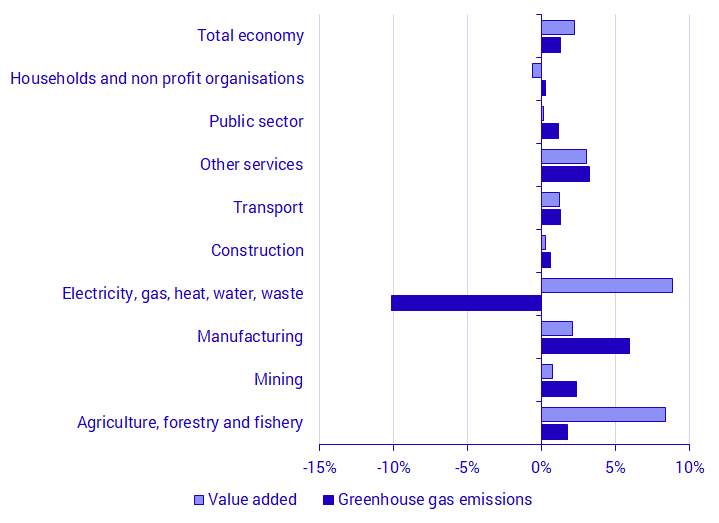
Greenhouse gas emissions from electricity, gas and heat supply fell by 10 percent compared with the corresponding quarter in 2018 due to reduced use of blast furnace gas for electricity production. However, emissions from the manufacturing industry increased by 6 percent over the same period due to increased fossil fuel use in the sector.

Source: Statistics Sweden
| NACE 2007 industry | Greenhouse gas emissions | Value Added | |||||
|---|---|---|---|---|---|---|---|
| 2019Q3 | Change compared to same quarter 2018 | 2019Q3 | Change compared to same quarter 2018 | ||||
| Agriculture, forestry and fishery | 2 341 | 41 | 1.8% | 17 322 | 1 339 | 8.4% | |
| Mining | 282 | 6 | 2.3% | 5 559 | 42 | 0.8% | |
| Manufacturing | 3 762 | 210 | 5.9% | 151 063 | 3 068 | 2.1% | |
| Electricity, gas, heat, water, waste | 1 285 | ‑145 | ‑10.1% | 26 823 | 2 183 | 8.9% | |
| Construction | 451 | 3 | 0.6% | 62 688 | 173 | 0.3% | |
| Transport | 3 575 | 44 | 1.3% | 43 566 | 526 | 1.2% | |
| Other services | 899 | 28 | 3.2% | 501 501 | 14 670 | 3.0% | |
| Public sector | 183 | 2 | 1.2% | 183 429 | 191 | 0.1% | |
| Households and non-profit institutions [1] | 2 485 | 6 | 0% | 13 541 | ‑80 | ‑0.6% | |
| Total economy | 15 263 | 196 | 1.3% | 1 133 971 | 22 229 | 2.0% | |
[1] Only non-profit institutions provide value added. Source: Statistics Sweden
Revisions
For the publication on the third quarter of 2019, air emissions due to mobile combustion for the time series starting from the first quarter of 2018 onwards have been calculated using a model based on the economic development in the sector over the period in question and on fuel supply data from earlier periods. The reason for the extrapolation for these quarters is that fuel supply data in the mobile sector from the monthly fuel, gas and inventory statistics has been deemed to be affected by considerable uncertainty. This uncertainty is related to an update of the survey used to produce the statistics that was implemented at the beginning of 2018. Against this background, the choice was made to use activity data for mobile combustion up to and including the fourth quarter of 2017 and extrapolation based on economic data thereafter.
Taken together, this uncertainty affects about 45 percent of total greenhouse gas emissions data, which should be kept in mind when interpreting the statistics. This applies, in particular, to the development in the period from the first quarter of 2018 onwards in the transport sector, the public sector, the construction sector, other services, and households. The total increase in greenhouse gas emissions from mobile combustion is estimated at 1 percent for the third quarter of 2019 compared with the corresponding period a year ago.
Efforts are underway to improve these statistics with a view to using the previous method again in the future.
More information (in Swedish) on the revisions is available at the Environmental Accounts’ product page under Documentation.
Definitions and explanations
The System of Environmental-Economic Accounting (SEEA) is constructed with the national accounts as a foundation, and presents environmental and economic statistics in a common system. The point of departure is Swedish economic actors’ environmental impact, regardless of where in the world the impact occurs. As the focus lies on economic actors, activities such as international transport are included in the same way as in economic statistics. Emissions and sequestration due to land use (LULUCF) and carbon capture and storage (CCS) are not included.
These statistics on air emissions apply a production perspective. This means that only direct emissions from Swedish economic actors are included. Indirect emissions arising from products imported to Sweden and other consumption activities are not included.
The statistics produced here are not used to follow-up emissions in relation to agreed-upon climate change goals in Sweden and internationally. Territorial statistics, reporting emissions occurring within the territory of Sweden are used for that purpose. More information about different principles applied in emissions reporting is available here:
Next publishing will be
The next statistical news, on emissions to air in the fourth quarter of 2019 including preliminary statistics for the whole year of 2019, is scheduled for publication on 2020-05-14 at 09:30.
Statistical Database
More information is available in the Statistical Database
Feel free to use the facts from this statistical news but remember to state Source: Statistics Sweden.
