Environmental Accounts – Emissions to air fourth quarter 2020 and preliminary statistics for year 2020
Greenhouse gas emissions from Sweden’s economy decreased by ten percent in 2020
Statistical news from Statistics Sweden 2021-05-12 9.30
Greenhouse gas emissions from Sweden’s economy decreased by ten percent in 2020 compared with 2019 according to preliminary statistics for 2020. This is due to emissions reductions in the transport, manufacturing and energy sectors. Sweden’s GDP decreased by 2.8 percent over the same period.
Preliminary statistics on greenhouse gas and other air emissions from Sweden’s economy are now available from SCB environmental accounts. The statistics are classified according to economic activity and include emissions from all Swedish economic actors, including households. The preliminary statistics for 2020 are a summation of quarterly statistics, where the fourth quarter is now ready.
Total greenhouse gas emissions from Sweden’s economy were 49.7 million tonnes of greenhouse gas equivalents in 2020. This is a decrease of 5.6 million tonnes of greenhouse gas equivalents compared to 2019. The economy’s greenhouse gas intensity, that is greenhouse gas emissions per Swedish krona of production in the economy, decreased by 7.5 percent over the same period.
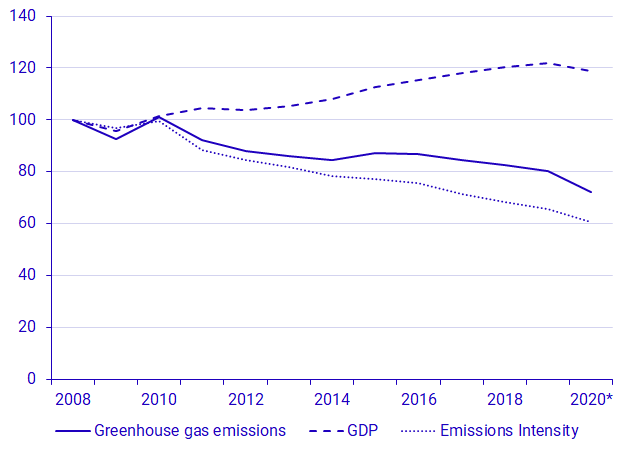
*Data for 2020 is preliminary. Source: Statistics Sweden
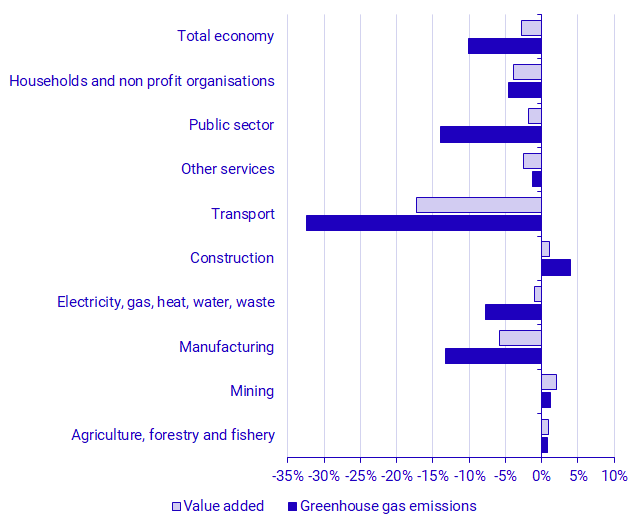
Greenhouse gas emissions decreased most from transport and manufacturing industries
Greenhouse gas emissions from the transport sector decreased by over 30 percent in 2020 compared with 2019, from 8.3 million tonnes of carbon dioxide equivalents in 2019 to 5.6 million tonnes of carbon dioxide equivalents in 2020. This is largely due to reduced emissions from domestic and international aviation as a result of decreased personal travel during the ongoing pandemic. During the same period, value added in the transport sector decreased by 17 percent.
Emissions from the manufacturing industry decreased by 13 percent during 2020 compared with 2019, from 15.0 million tonnes of carbon dioxide equivalents in 2019 to 13.0 million tonnes of carbon dioxide equivalents in 2020. The majority of the reduction in the manufacturing industry arose in iron and steel production, with over 1.2 million tonnes of carbon dioxide equivalents lower emissions in 2020 compared with 2019. Emissions reductions in petroleum and chemical production also contributed significantly to overall emissions reductions for the manufacturing industry over the same period. Value added for the manufacturing industry overall decreased by 6 percent in 2020 compared with 2019.
Greenhouse gas emissions from the utilities sector (where emissions from electricity and district heating production are a large part) decreased by 8 percent in 2020 compared with 2019. Households’ emissions decreased by 5 percent in 2020 compared with 2019, principally from personal cars.
Source: Statistics Sweden
| NACE 2007 industry | Greenhouse gas emissions | Value Added | |||||
|---|---|---|---|---|---|---|---|
| 2020 | Change compared to 2019 | 2020 | Change compared to 2019 | ||||
| Agriculture, forestry and fishery | 8 951 | 74 | 0.8% | 70 027 | 631 | 0.9% | |
| Mining | 1 191 | 14 | 1.2% | 33 107 | 676 | 2.1% | |
| Manufacturing | 12 993 | ‑1 991 | ‑13.3% | 617 565 | ‑38 135 | ‑5.8% | |
| Electricity, gas, heat, water, waste | 6 642 | ‑554 | ‑7.7% | 123 154 | ‑1 164 | ‑0.9% | |
| Construction | 1 921 | 73 | 4.0% | 306 686 | 3 279 | 1.1% | |
| Transport | 5 577 | ‑2 680 | ‑32.5% | 150 948 | ‑31 383 | ‑17.2% | |
| Other services | 3 377 | ‑45 | ‑1.3% | 2 080 798 | ‑52 980 | ‑2.5% | |
| Public sector | 584 | ‑94 | ‑13.9% | 888 066 | ‑16 416 | ‑1.8% | |
| Households and non-profit institutions [1] | 8 487 | ‑412 | ‑4.6% | 55 780 | ‑2 235 | ‑3.9% | |
| Total economy [2] | 49 722 | ‑5 616 | ‑10.1% | 4 883 466 | ‑141 597 | ‑2.8% | |
[1] Only non-profit institutions provide value added. [2] GDP with a production approach. Source: Statistics Sweden
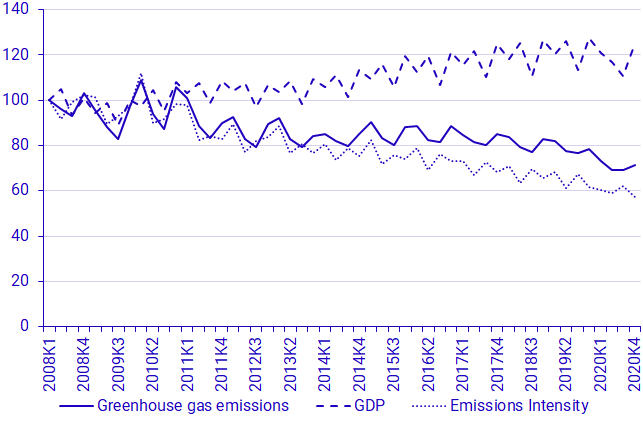
Emissions decreased in the fourth quarter of 2020
In the fourth quarter of 2020, greenhouse gas emissions from the Swedish economy were 12.6 million tonnes of carbon dioxide equivalents. This is 9 percent lower than for the fourth quarter of 2019. GDP in the fourth quarter of 2020 was 1.7 percent lower than the same quarter in 2019.
Revisions
Since the previous publication on 4 February 2021 the following methodological revision has been implemented:
Emissions from non-road machinery, road traffic and aviation for the period 2020Q1 and onward are now calculated using data from Statistics Sweden’s monthly fuel survey. In the previous publication, these emissions had been extrapolated based on other physical data. For the periods 2018Q1 to 2019Q4, data from the register of reports to the Swedish Energy Agency in accordance with Sweden’s implementation of the EU’s Renewable Energy Directive are still used as activity data for these emissions sources. The reason for using Statistics Sweden’s monthly fuel survey starting from 2020Q1 is that statistics producers have assessed that data from the survey for the reference year 2020 are of high accuracy. Comparisons between the periods 2018Q1 and 2019Q4 and other quarters should therefore be made with caution.
For more information about implemented revisions, please see the environmental accounts’ product page under the heading Documentation (in Swedish).
Definitions and explanations
Preliminary statistics - frequently asked questions
Statistics Sweden and the Swedish Environmental Protection Agency (EPA) are now publishing statistics on greenhouse gas and other air emissions for the year 2020.
The statistics published by Statistics Sweden and the Swedish Environmental Protection Agency differ. Below, answers to some frequently asked questions explain how the two statistics and their respective uses differ.
What are the statistics about?
The Swedish EPA presents statistics on greenhouse gas emissions arising on Swedish territory, and are also called simply “territorial statistics”. Statistics Sweden presents statistics on greenhouse gas and other air emissions from the Swedish economy, also known as statistics with a production perspective.
Both of these statistics are classified as official statistics, which means that they follow established guidelines for timing and method of publication, quality assurance and documentation.
Are there differences in the statistics, and if so why?
Yes, the statistics differ in the scope and the classification of the reported emissions.
The territorial statistics include all emissions occurring within the borders of Sweden. Statistics with a production perspective include emissions from Swedish economic actors, irrespective of where in the world they occur. These differing scopes lead to differences in absolute emissions levels for each of the statistics. Since the statistics with a production perspective include emissions arising from international transport, which territorial statistics do not, emissions according to a production perspective are typically greater than territorial emissions. More specifically, statistics with a production perspective include all emissions from Swedish economic actors outside Sweden’s borders (e.g. Swedish aviation companies’ international flights), which territorial statistics do not. Conversely, foreign economic actors’ emissions inside Swedish territory (e.g. foreign road transport companies) are included in the territorial statistics, but are excluded according to the production perspective. Territorial statistics also include removals of greenhouse gases (e.g. in forests) within Swedish borders.

Emissions with a territorial perspective are presented according to the activity or process causing the emissions, such as transport, non-road machinery, and space heating. Emissions with a production perspective are classified according to the same economic sectors as used in the system of national accounts, such as iron and steel industry, agriculture and forestry companies, and property management.
Are the differences significant for how the statistics can be used?
Yes, they are significant. Territorial statistics are used to monitor progress towards climate goals in Sweden, the EU, and the UN.
Territorial statistics are reported to the UNFCCC and are compiled to show which activities and processes are causing emissions in each country. Territorial emissions are used as a starting point for each country’s target setting in the international process, since it is assumed that each country has the capacity to implement laws and rules to reduce emissions in line with the established targets.
In contrast, statistics with a production perspective are used to answer questions about which components of economic production and consumption contribute to emissions. It is also possible to analyse the emissions intensity of production (emissions per unit of monetary production) and of employment for each economic sector and the economy as a whole.
Why are two government agencies publishing nearly identical statistics?
In Sweden, there are 28 government agencies that are responsible for official statistics within their respective areas. Within the area of environment, four government agencies are responsible for official statistics. The Swedish EPA is responsible for official statistics on emissions, waste, and environmental permitting. Statistics Sweden, meanwhile, is responsible for official statistics on environmental accounts, using the same classification system as for economic statistics, which Statistics Sweden is also responsible for. Statistics Sweden is also responsible for statistics on sustainable development, as well as land and water use, and soil enrichment with fertilisers, and liming.
Why are there two different statistical standards on greenhouse gas and other air emissions?
The two different statistical standards answer different questions. Questions about how the economy affects the environment need to be answered using a different scope than questions about environmental impact arising within a country’s territory. The frameworks have been developed by experts who have ensured that the statistics that are produced are globally comparable for the specific purpose they serve. All countries that produce this type of statistics must follow the dedicated framework and strive to ensure that the same activities are included in the statistics for comparability.
For international reporting to the UN climate change convention, the guidelines have been developed by the UN panel on climate change:
The Intergovernmental Panel on Climate Change
For environmental accounts, a framework developed by the UN Statistical Division is available:
Both statistical products are reported at the international level, to the UN, Eurostat, and the European Environment Agency, in line with regulations and conventions.
How are the government agencies cooperating in this field?
Statistics Sweden and the Swedish EPA collaborate to produce explanatory texts to build an understanding and consensus around the differing statistics. The two agencies jointly participate in conferences and on other platforms to communicate about their work. For example, the two agencies have together discussed statistics on greenhouse gas emissions on Statistics Sweden’s podcast:
Kapitel 6. Miljö och klimat, Soundcloud
The most significant collaboration is conducted through the SMED consortium (in which Statistics Sweden is a main partner), which has been commissioned by the Swedish EPA to produce preliminary and final yearly territorial emissions statistics. This collaboration also facilitates a knowledge and data exchange between the agencies.
For further information about the statistics (in Swedish), see below.
About territorial statistics:
Kvartals- och preliminära årsvisa växthusgasutsläpp
About statistics with a production perspective:
About the statistics - documentation
A joint description of the statistics:
Next publishing will be
The next statistical news on quarterly emissions to air, on the first quarter of 2021, is scheduled for 9:30 on 2 September 2021.
Statistical Database
More information is available in the Statistical Database
Feel free to use the facts from this statistical news but remember to state Source: Statistics Sweden.