Environmental accounts – Emissions to air 2021, regional statistics
Regional greenhouse gas emissions are increasing
Statistical news from Statistics Sweden 2023-11-23 8.00
Greenhouse gas emissions at the regional level in Sweden increase in 2021 compared to 2020. The increase in emissions comes mainly from the production of goods, the service sector and from the use of petrol and diesel in households. With the exception of Halland and Gävleborg regions, the increases in emissions are visible all over the country.
– Almost all regions increase emissions of greenhouse gases in 2021 compared to the previous year. In general, the production of goods account for the largest increase in emissions, says Max Jonsson, analyst at Statistics Sweden's environmental accounts.
Regional greenhouse gas emissions based on their economic activity in 2021
Greenhouse gas emissions from Sweden's economy amount to 51 million tonnes of carbon dioxide equivalents in 2021, which is an increase of two million tonnes compared to 2020. With the exception of marginal emission reductions in Halland and Gävleborg, the regions of Sweden show increases in production-based emissions in 2021. The largest percentage increase in emissions occurs in Blekinge region and in Norrbotten, where emissions increase by 13 and 9 percent respectively. In general across the country, it is the production of goods that accounts for the largest increases in emissions. The year 2021 is the second year of the covid-19 pandemic and although emissions are generally increasing compared to 2020, the emission levels are still lower than the 2019 pre-pandemic level.
The largest share of Sweden's greenhouse gas emissions in 2021 comes from Västra Götaland region, emitting 11.2 million tonnes of carbon dioxide equivalents and corresponding to 22 percent of the country's emissions. The regions of Stockholm, Skåne and Norrbotten emit 6 million tonnes, 5.6 million tonnes and 5.2 million tonnes of carbon dioxide equivalents respectively, which corresponds to 12, 11 and 10 percent of Sweden’s emissions.
Emission intensity by region
The emission intensity (emissions of greenhouse gases in relation to the gross regional product) in 2021 decreases for most of Sweden's regions. The largest percentage reduction in emission intensity compared to previous year occurs in Norrbotten, where the intensity decreases by 11 percent, followed by Värmland where the emission intensity decreases by 9 percent.
The emission intensity in 2021 differs across the country. For the region of Gotland, the emission intensity is 106 tonnes of carbon dioxide equivalents per million SEK. The corresponding figure for the region of Stockholm is 3.4. For the whole country, the emission intensity is 9.4 tonnes of carbon dioxide equivalents per million SEK. One explanation for the large variations is the location of emission intensive industries around the country.
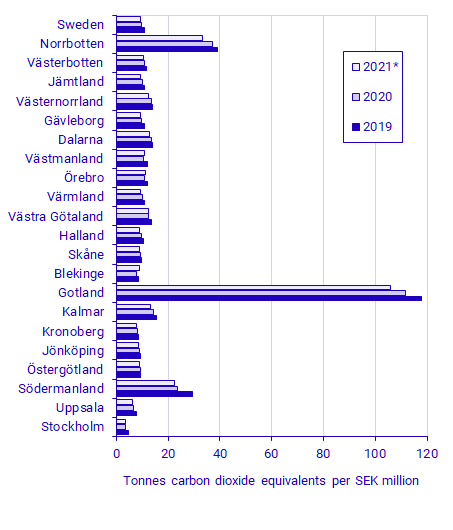
* The 2021 gross regional product is preliminary. Source: SCB
Environmental economic profile by region
An environmental economic profile can be used to provide a general description of a region’s environmental economic structure. This profile shows the region’s share of Sweden’s gross domestic product (GDP), greenhouse gas emissions and employees.
In many regions, the share of greenhouse gas emissions is roughly the same as the share of employees and the share of GDP. The regions of Västra Götaland, Norrbotten, Södermanland, and Gotland, on the other hand, have emission-intensive profiles, in which the share of greenhouse gas emissions is larger than the share of employees and of GDP. This is due to emission-intensive industries and/or numerous shipping companies in these regions.
In Västra Götaland region, levels of output of both goods and services are high. This leads to a high share of employees, GDP and greenhouse gas emissions. However, in Norrbotten region the share of employees and GDP are smaller, but the share of greenhouse gas emissions is high. This is due, in part, to the presence of manufacturing industries with high emissions and few employees.
In the Stockholm region, there is a high share of employees and high contributions to GDP. The largest industries in Stockholm region are in service sectors, in which the levels of greenhouse gas emissions are relatively low.
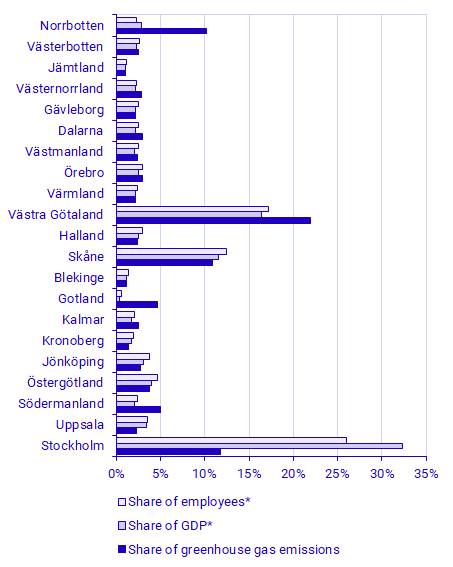
* The 2021 gross domestic product and employees are preliminary data. Source: SCB
Definitions and explanations
Statistics Sweden’s environmental accounts publishes regional emissions to air per industrial sector at regional, county and municipal level. The statistics include emissions, emission intensities and environmental economic profiles. The statistics follow the framework of the national accounts, which means that emissions are linked to the specific economic activities responsible for the emissions. This does not necessarily imply that the emissions actually occur in a specific region, but rather that the economic actor responsible for the emissions is located there.
The Environmental Accounts are compiled according to the framework of the System of Environmental and Economic Accounts (SEEA) and show national environmental statistics and economic statistics in the same framework, using NACE industry classification. The objective is to measure Swedish economic actors’ emissions and environmental pressures, irrespective of where they occur geographically.
Therefore, a residence adjustment is applied in order to adjust statistical sources with a territorial perspective to the national and environmental accounts’ economic perspective. The residence adjustment applies primarily to transports, such as heavy duty road transport. It mostly refers to land transport companies (H49) but also in other industries such as construction (F41-43), water transport (H50) and air transport (H51). Further information about the residence adjustment can be found in the document (in Swedish) concerning the quality of the statistics on the Environmental Accounts webpage. These statistics are also explained in more detail in the Environmental Accounts Statistical Report 2017:2 Regional Environmental Accounts 2008–2015.
The regional emissions statistics from Statistics Sweden's environmental accounts report production-based emissions to air per industry from Sweden's economy, which also includes households. Production based emissions include emissions of greenhouse gases by Swedish economic actors and differ in that respect from the territorial emissions, which instead refers to national borders and constitutes the statistics used to follow up the climate goals within the UN, the EU and nationally.
Regional statistics on air emissions reported by SMHI refer to territorial emissions, which thus is emissions that occur within the boundaries of each region. This means that SMHI’s statistics can be used to monitor air pollution levels in a specific area.
Next publishing will be
The next publication of regional statistics on air emissions is scheduled for the autumn of 2024.
Statistical Database
More information is available in the Statistical Database
Feel free to use the facts from this statistical news but remember to state Source: Statistics Sweden.