Environmental accounts – environmental pressure from consumption 2017 - corrected 2020-01-24
Environmental pressure from consumption – new official statistics
Statistical news from Statistics Sweden 2019-11-19 9.30
Starting 2019, data on environmental pressure from consumption are a part of Sweden’s official statistics within the environmental accounts framework. The statistics cover environmental pressure due to the purchase of goods and services by industry, households and public institutions in Sweden. Products produced in Sweden and abroad are included, as well as products that are exported. The environmental pressures covered include greenhouse gases and other air emissions.
The statistics are produced using input-output analysis, where the frameworks for national and environmental accounts are used. Production of the statistics builds on a recently completed research project, PRINCE, where a method for calculating Sweden’s environmental pressures overseas due to domestic consumption was established.
The Swedish Environmental Protection Agency and Statistics Sweden have collaborated for many years to produce statistics, and to improve methods to assess consumption’s climate impact. It is planned that the statistics be produced yearly and will be included as component of the environmental accounts produced by Statistics Sweden. In the future it is intended to expand the environmental aspects considered from the current focus on greenhouse gas and other air emissions.
Environmental pressure from consumption – measuring environmental pressure from final demand
National accounts measures gross domestic product (GDP) from a production perspective and a use perspective. Environmental accounts does this from an environmental perspective. Whereas the production perspective answers the question “who is emitting”, the consumption perspective answers the question “For whom do the emissions occur?”
Environmental pressure from consumption calculates emissions from demand and includes final household and general government expenditures and investments, according to the same disaggregation as used by the system of national accounts. Environmental pressure from the production of goods and services for export are also included.
Greenhouse gas emissions from Swedish consumption decreased between 2008 and 2017
Greenhouse gas emissions from Swedish consumption (i.e. from households, general government and investments but excluding exports) increased by 6 percent between 2014 and 2017. However emissions decreased by 10 percent between 2008 and 2017. The decrease over this time period is due partly to reduced emissions from Swedish production and partly to reduced emissions from sea transport for many of Sweden’s significant trading partners, such as USA, Germany and Japan.
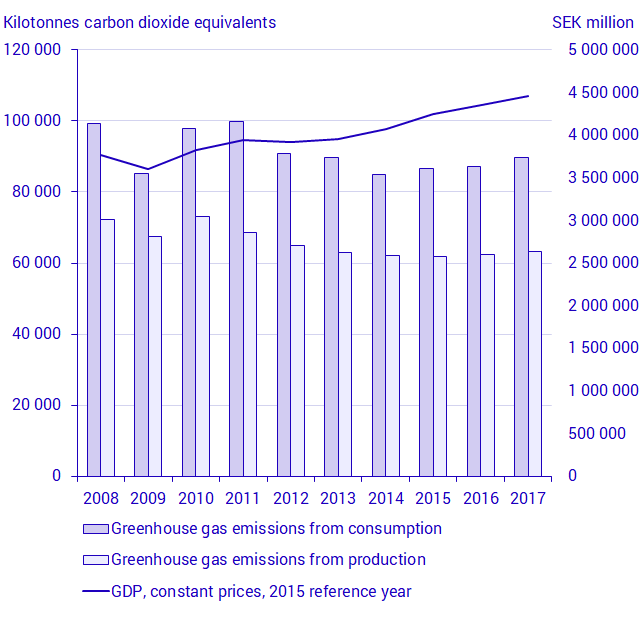
Source: Statistics Sweden
*Swedish consumption comprises household and general government consumption and investments.
**Time series break in 2015 (due to general review of national accounts)
Households greenhouse gas emissions related to consumption an important factor
Greenhouse gas emissions from households’ consumption amounted to nearly 54 Mt CO2-equivalents in 2017, and compared to 2008 it is a decrease with 14 per cent. Between 2016 and 2017 the emissions see a minor increase.
Swedish exports are also a significant driving force for greenhouse gas emissions from consumption and also this has seen a decrease, from 92 Mt CO2-equivalents in 2008 to 72 Mt in 2017.
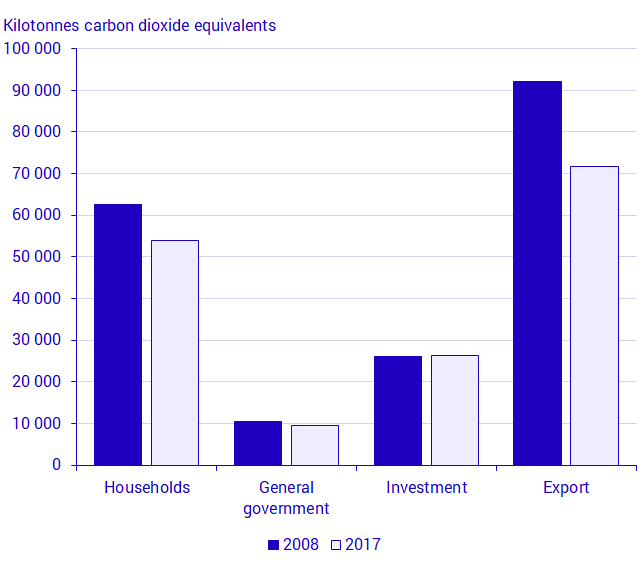
Source: Statistics Sweden
Lower emissions from household consumption
Greenhouse gas emissions from household consumption decreased between 2008 and 2017 in all areas, including food products, transport, housing, textiles and shoes and for other products.
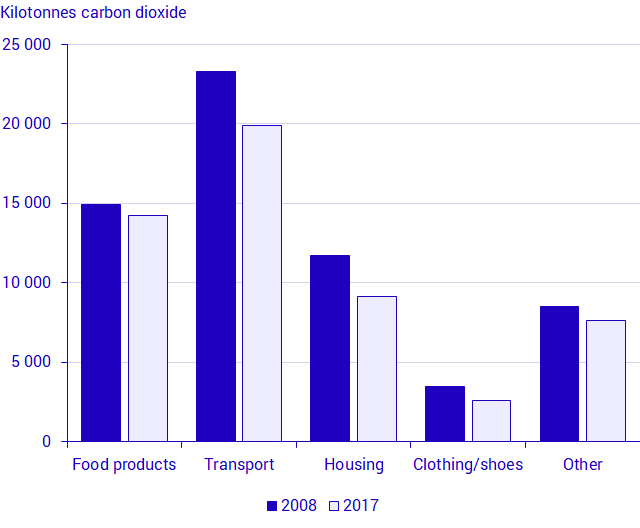
Source: Statistics Sweden
A large proportion of household consumption is imported, which gives rise to a large proportion of greenhouse gas emissions. For example, over 60 % of greenhouse gas emissions from household consumption of food products arise from directly imported food products and from products imported for use in the supply chain for food products.
Revisions
Statistics about environmental pressure from consumption have previously been published by Statistics Sweden and the Swedish Environmental Protection Agency in the form of detailed data and indicators. Revisions in the calculation methodology have been implemented for this publication, which has caused time series data to differ with previous publications.
Separate calculation procedures are used imported and domestic productions’ parts of environmental pressure from consumption. Revisions for each procedure are presented separately below.
Revisions in calculation procedure for environmental pressure from consumption from domestic production
The figure below compares time series for greenhouse gas emissions from consumption for domestic production’s part that were produced in 2018 and 2019 respectively (the solid and the dotted lines). Two types of revisions have been implemented.
National accounts at Statistics Sweden have implemented a general review of their calculation procedures. This has led to a time series break in 2015. National accounts carry out a wider review of yearly source statistics, methods and calculation models every 5 years in multiple areas. The results from the most recent review (carried out in 2019) have led to an increase in total GDP and a reallocation of production between sectors. More information about this review can be found here:
Revised Swedish GDP in September 2019
Calculations of environmental pressure from consumption for this publication have included revised data from national accounts from 2015 on. The older time series, from 2008 to 2014 is unchanged for the calculations for this publication compared to the calculations carried out in 2018.
Lesser revisions of environmental accounts’ air emissions accounts for the time series 2008 – 2017 have also brought about changes in the sector-wise allocation of emissions. These revisions relate specifically to sectoral allocation for non-road machinery and heating in non-residential buildings.
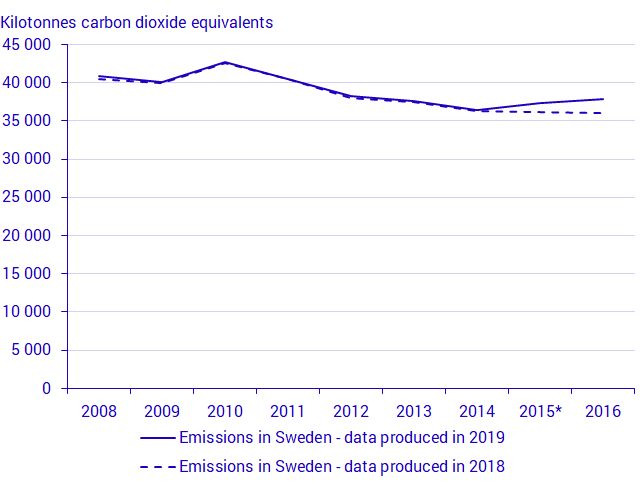
Source: Statistics Sweden
*Time series break 2015 due to general review of national accounts
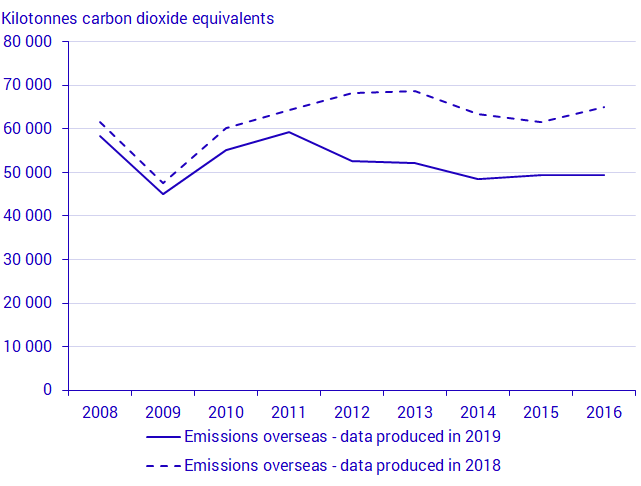
Revisions of calculation procedure for environmental pressure from consumption arising from imported goods and services
SCB uses a multiregional database, Exiobase, to calculate consumption emissions due to imported products and services. The database is developed and maintained by a consortium led by the Norwegian University of Science and Technology in Trondheim, Norway.
In 2019, the most recent version of Exiobase, version 3.7 was used. In 2018, Exiobase version 3.3 was used.
Important updates implemented in version 3.7 include:
- Macroeconomic and trade data for recent years
- Energy and energy-related emissions
- Sector-wise allocation of energy and energy-related emissions
- Land and water-related data
- Co-efficients for environmentally-relevant flows
- Balancing algorithms
The figure below shows time series for greenhouse gas emissions from consumption due to imported goods and services. The figure shows that the updates mentioned above have led to relatively large differences between the time series for calculations performed this year and last year, both in terms of trends and absolute levels.
More information can be found in the following peer-reviewed journal article:
Source: Statistics Sweden
Definitions and explanations
These statistics are a part of environmental accounts. Environmental accounts are established with the national accounts as a foundation and present national environmental statistics and economic statistics in a common framework. Environmental data is systematised according to the same sectoral structure and areas for final use as economic data. The main goal of this systematisation is to analyse the relationship between economic and environmental performance.
Statistics on environmental pressure from consumption shows environmental pressure in relation to the macroeconomic balancing equation that is the basis for the national accounts. The equation for Sweden’s balance is as follows:
P+M=C+G+I+E
In which P is Sweden’s GDP, M are total imports to Sweden, C is household consumption, G is general government consumption, I is gross capital formation, and E is total export to other countries from Sweden.
According to the system of national accounts, all variables are presented in monetary terms.
The statistics presented in this publication show greenhouse gas and other air emissions for each term in the equation. For each term, the environmental pressure is allocated to over 40 different product groups. For household consumption, environmental pressure is presented according to the international COICOP allocation (classification of individual consumption by purpose).
Relationship to other official emissions statistics
Starting with this publication, official statistics on greenhouse gas and other air emissions are presented from three complementary perspectives:
- From Sweden’s economy with a consumption perspective (these statistics)
- From Sweden’s economy with a production perspective
- From Sweden’s territory (territorial statistics)
Statistics Sweden is responsible for statistics with a production and consumption perspective, as a part of the system of environmental economic accounts. Statistics with a consumption perspective are unique since they present environmental pressure for all goods and services that are produced and used in the Swedish economy along their entire production chain. This is particularly interesting for Sweden since a large proportion of goods and services that are used in the Swedish economy are imported. Sweden also exports a large proportion of the domestic production.
Environmental accounts’ official statistics from a production perspective present greenhouse gas and other air emissions from the Swedish economy’s total domestic production of goods and services, allocation sector-wise. This system boundary represents the P-term in the equation above and includes Swedish economic actors’ environmental pressure irrespective of where in the world the pressure occurs.
The Swedish Environmental Protection Agency produce official territorial statistics, presenting those environmental pressures that occur within Sweden’s borders.
All of the statistics mentioned are included in Sweden’s official statistics and they follow uniform guidelines for when and how the statistics are published, quality assurance and documentation.
Results differ between different official statistics
The different system boundaries for the different official statistics on environmental pressures leads to differences in the absolute emissions levels. Air emissions from a production perspective include as good as all air emissions included in territorial statistics as well as emissions from international transport operated by Swedish economic actors. Emissions from a production perspective are therefore in practice greater that emissions from a territorial perspective, that exclude emissions from international transport.
Swedens imports and exports are almost exactly balanced, with exports slightly greater. At the same time, the greenhouse gas emissions intensity (emissions per unit production in monetary terms) for domestic production in Sweden is less than that for Sweden’s major trading nations. The result is that statistics with a consumption perspective show greater greenhouse gas emissions than those with a production perspective, even excluding emissions from Sweden’s export.
The different official statistics can also be used for different purposes. Statistics from environmental accounts can support policy analyses from an economic and environmental perspective, or for investment and procurement decisions.
Territorial statistics are used to follow the development of emissions in relation to climate change goals in Sweden, the EU and the UN. The statistics present which emissions sources are present in the country. Countries therefore have significant jurisdiction over laws and rules that can affect emissions and can easily perform calculations of national reduction targets.
More information about the different perspectives:
Territorial statistics (in Swedish):
Kvartals- och preliminära årsvisa växthusgasutsläpp
Environmental accounts’ air emissions accounts:
System of Environmental and Economic Accounts
The Swedish Environmental Protection Agency and Statistics Sweden’s joint description of the statistics (in Swedish):
Tre sätt att beräkna klimatpåverkande utsläpp
Glossary of selected terms:
Household consumption
Consumption by households and private citizens. Includes non-profit institutions serving households (NPISH).
General government consumption
Consumption by state, county and municipal authorities.
Investments
Investments by general government and industry, for example procurement of machines, buildings and roads. Investments can be subdivided into gross fixed capital formation, changes in inventories and the net acquisition of valuables.
Export
Foreign actors’ use of goods and services arising from Swedish production.
Final consumption/demand/use
Terms used interchangeably for the sum of general government consumption, household consumption, investment and export. “Final” refers to the fact that it is not used in the production chain, rather it is the end of the production chain.
Component
A part of final use, e.g. for household consumption or export. Each component generates emissions in Sweden and overseas due to import for final use and imports to be used domestically for the production of other goods and services.
Emissions from consumption, consumption perspective
Emissions arising from the consumption of goods and services in Sweden and overseas due to imports.
Emissions from production, production perspective
Emissions arising from the production of goods and services in the economy.
Next publishing will be
Statistics on sector-wise air emissions are published throughout 2020, quarterly and yearly.
Statistical Database
More information is available in the Statistical Database
Feel free to use the facts from this statistical news but remember to state Source: Statistics Sweden.