Social security in Sweden 1993–2021
Expenditure on social protection decreased in relation to GDP
Statistical news from Statistics Sweden 2023-03-31 8.00
Social protection expenditures as a share of GDP decreased from 29.4 percent in 2020 to 28.0 percent in 2021. Social protection expenditures in current prices increased, but less compared to the increase of GDP.
In 2021, total expenditures on social protection increased by SEK 47.4 billion, which corresponds to 3.2 percent. The corresponding increase between 2019 and 2020 was 5.5 percent. Total expenditures for social protection amounted to SEK 1 527 billion in 2021.
Expenditures on social protection as a share of GDP has varied from year to year. The share fell from 35.6 percent in 1993 to 28.0 percent in 2021. Between 1993 and 2000, the share decreased steadily, and amounted to 28.0 percent in 2000. In the 2000s, the share varied between 27.2 percent (in 2007) and 30.1 percent (in 2003).
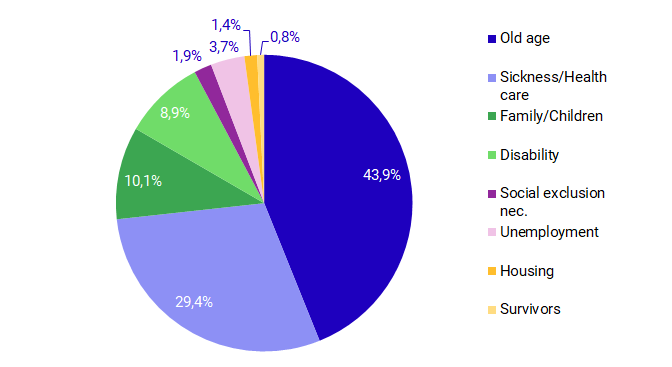
Expenditure on the elderly was the largest expenditure item
The largest expenditure item was the elderly, which amounted to 44 percent of social benefits in 2021. The second largest expenditure item was health and medical care, which accounted for 29 percent of total social benefits. This was followed by expenditure on family/children and disability, which accounted for 10 percent and 9 percent of total social benefits respectively.
Expenditures on the elderly increased by SEK 22 billion, an increase of 3.5 percent between 2020 and 2021. Old age pension, which is the largest item of expenditure on old age, increased by SEK 17.6 billion, which corresponds to 3.7 percent.
Health care
Expenditures on health and medical care increased by SEK 24 billion, which corresponds to 10 percent. Expenditures on both inpatient and outpatient care increased. Inpatient care increased by SEK 10.3 billion, which corresponds to 8.2 percent more than last year. Outpatient care increased by SEK 17.2 billion, which corresponds to 3.8 percent. Expenditures on paid sick leave decreased by SEK 4.4 billion in the same period. This was a decrease from a relatively high level in 2020 when the Covid-19 pandemic occurred. Expenditures on paid sick leave amounted to SEK 87.1 billion in 2020, compared to SEK 82.7 in 2021. In 2019, expenditures in sick paid leave amounted to SEK 67.5 billion.
Disability
In 2021, expenditures on disability increased by SEK 1.4 billion, which corresponds to 1.0 percent. The item comprising assistance in carrying out daily tasks increased by SEK 0.9 billion, which corresponds to 2.3 percent, in 2021, while Accommodation increased by SEK 1.4 billion, which corresponds to 4.5 percent. Cash benefits in the form of disability pension continued to decrease; in 2021 this decrease amounted to SEK 1.6 billion.
Family/Children
Expenditures on family and children increased by SEK 1.5 billion, corresponding to an increase of 1,0 percent between 2020 and 2021. Cash benefits in total increased in 2021. Birth grant increased the most, by SEK 0.7 billion, corresponding to an increase of 2.1 percent.
Benefits in kind also increased in total in 2021, but the largest item comprising Child care for preschool children decreased by more than SEK 0.5 billion and amounted to SEK 51.4 billion. The item comprising Accommodation saw the largest increase by just over SEK 0.7 billion, corresponding to 4.0 percent.
Social exclusion
Expenditures on other social exclusion continued to decrease in 2021. Expenditures also decreased between 2017 and 2019, following two years of relatively large increases due to a high level of immigration. The decrease in 2021 was mainly related to decreased expenditures on Other social services and Accommodation as a result of fewer asylum seekers. Between 2020 and 2021, expenditures on Other social services decreased by 1.0 billion, which corresponds to 25 percent, and Accommodation decreased by SEK 0.5 billion, which corresponds to 8.9 percent. Total expenditures on social exclusion decreased by SEK 2.2 billion, corresponding to 7.2 percent, and amounted to SEK 28.9 billion.
Unemployment
In 2021, total expenditures on unemployment increased by 2.4 billon or roughly 4.6 percent, compared to 2020. Among cash benefits, expenditures on Vocational training allowance saw the largest increase by 4.8 billion, corresponding to an increase of 32 percent. The item comprising Full employment benefit still was the largest and amounted to SEK 22.8 billion, which was a decrease by SEK 2.8 billion, corresponding 10.8 percent. Expenditures on Redundancy compensation decreased by SEK 2.2 billion, which corresponded to a decrease by 72 percent, and amounted to SEK 0.9 billion. This was due to a decrease in the expenditure for salary or wage compensation as a decreasing number of employees were laid off due to bankruptcy or restructuring between 2020 and 2021.
| Function | 2016 | 2017 | 2018 | 2019 | 2020 | 2021 |
|---|---|---|---|---|---|---|
| 1. Sickness/Health care | 330 674 | 341 184 | 360 613 | 378 513 | 416 588 | 440 605 |
| 2. Disability | 127 193 | 129 644 | 133 179 | 132 915 | 132 000 | 133 381 |
| 3. Old Age | 546 730 | 569 490 | 587 960 | 607 915 | 636 941 | 658 949 |
| 4. Survivors | 13 685 | 13 375 | 12 767 | 12 412 | 12 050 | 11 458 |
| 5. Family/Children | 130 987 | 135 601 | 145 343 | 149 835 | 149 947 | 151 424 |
| 6. Unemployment | 45 152 | 45 402 | 42 272 | 39 776 | 52 921 | 55 366 |
| 7. Housing | 18 307 | 18 269 | 19 168 | 19 043 | 20 858 | 20 682 |
| 8. Social exclusion nec. | 59 937 | 48 884 | 39 450 | 34 559 | 31 122 | 28 895 |
| Expenditures for social protection benefits | 1 272 665 | 1 301 849 | 1 340 752 | 1 374 968 | 1 452 427 | 1 500 760 |
| As a % of GDP | 28.8 | 28.1 | 27.8 | 27.2 | 28.8 | 27.5 |
| Administration costs/Other expenditures | 25 218 | 26 577 | 26 715 | 27 124 | 27 476 | 26 571 |
| Social protection expenditure | 1 297 883 | 1 328 426 | 1 367 467 | 1 402 092 | 1 479 903 | 1 527 331 |
| As a % of GDP | 29.4 | 28.7 | 28.3 | 27.8 | 29.4 | 28.0 |
International comparisons
In the early 1990s, Sweden had the highest level of social protection expenditure in relation to GDP compared with other countries in the EU. In recent years, Sweden’s expenditures have been just below the EU average. This was also the case in 2021 when Sweden had a share of GDP at 29.3 percent, in comparison to EU-27, which had a share of GDP at 31.7 percent.
In 2021, France had the highest level of expenditure on social protection as a share of GDP, at 38.1 percent. Italy had the second highest levels of expenditure on social protection, at 34.3 percent of GDP, followed by Austria and Germany at 34 percent and 33 percent of GDP respectively. In the Nordic countries, Denmark had the highest level of expenditure on social protection as a share of GDP, at 32.9 percent. Finland, Norway and Iceland followed with shares at 31.9 percent, 30.8 percent and 30.4 percent of GDP respectively. Ireland was the EU country with the smallest share, 15.5 percent.
Main tables - Social protection - Eurostat (europa.eu)
The different taxation regulations pose a major problem for international comparisons. Some countries regulate taxes on certain benefits, while others do not. In addition, some benefits in certain countries consist of tax deductions, while other countries pay the benefit directly. Slightly more than half of the social protection benefits in Sweden are cash benefits. Most of these cash benefits are taxable. If taxation is taken into account, the percentage of GDP from benefits in 2021, excluding administration costs, fell from 27.5 percent including tax to 24.5 percent excluding tax.
Definitions and explanations
Social protection is defined here as all services from public or private organisations with the purpose of reducing the burden on households and individuals from specially defined risks or meeting specially defined needs. A prerequisite is that these services do not require a return of services and that they are not based on individual arrangements. The benefits may be either in cash or in kind.
Feel free to use the facts from this statistical news but remember to state Source: Statistics Sweden.