NATO preferences by political party preference
Share of eligible voters who are positive towards Sweden's NATO membership, by political party preference. Percent
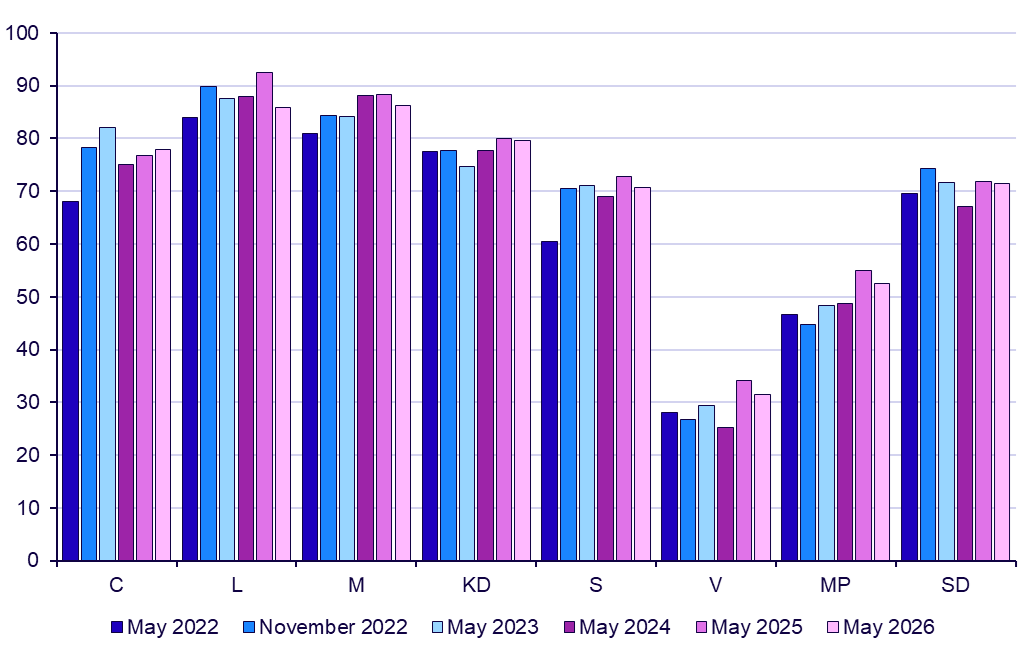
May 2026. Distribution of responses in percent by political party preference
| Positive | Negative | Do not know/do not want to answer |
||||
|---|---|---|---|---|---|---|
| Percent | Margin of error |
Percent | Margin of error |
Percent | Margin of error |
|
| C | 78.0 | ±5.7 | 13.0 | ±4.6 | 9.0 | ±4.0 |
| L | 85.9 | ±5.2 | 9.3 | ±4.3 | 4.8 | ±3.3 |
| M | 86.3 | ±2.4 | 8.8 | ±1.9 | 4.9 | ±1.5 |
| KD | 79.7 | ±6.2 | 11.9 | ±5.0 | 8.4 | ±4.4 |
| S | 70.7 | ±2.6 | 19.7 | ±2.2 | 9.6 | ±1.7 |
| V | 31.4 | ±5.3 | 55.2 | ±5.7 | 13.4 | ±4.1 |
| MP | 52.5 | ±6.6 | 34.4 | ±6.3 | 13.1 | ±4.7 |
| SD | 71.5 | ±3.8 | 20.7 | ±3.4 | 7.8 | ±2.3 |
| Total | 67.9 | ±1.5 | 21.0 | ±1.3 | 11.1 | ±1.1 |
Question: Are you positive or negative towards Sweden's NATO membership?
More about the results
Source
SCB
Last updated
2026-06-10