Green space and green areas in urban areas 2020
Green structure of every urban area mapped
Statistical news from Statistics Sweden 2025-12-16 8.00
For the second time, Statistics Sweden has mapped the green structure in all of the country’s approximately 2 000 urban areas (localities). The survey has been made possible thanks to the collaboration of several national authorities in funding and producing the National Land Cover Database (NLCD), which serves as the primary data source for the survey.
Since the 1980s, Statistics Sweden has conducted surveys of green spaces and green areas in localities. Previously, it was only possible to carry out sample surveys in a selection of larger urban areas. It was not until 2015 that all localities could be covered, thanks to the availability of the first edition of the National Land Cover Database (NLCD). The survey has now been repeated based on the second edition of the NLCD, with new 2020 figures.
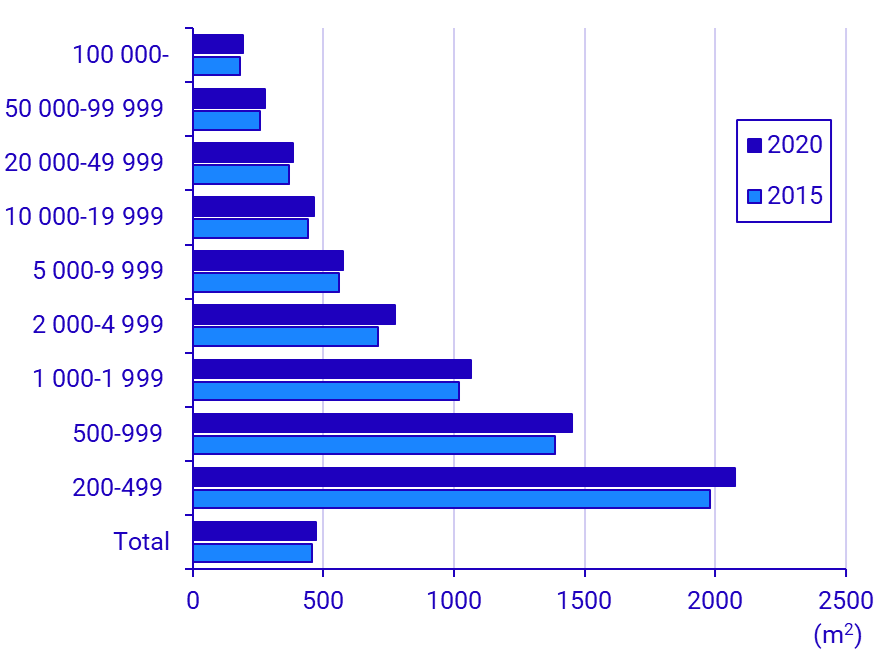
Small localities are greenest
On average, green space accounted for 67 percent of the land area in localities in 2020. It is hardly surprising that the smallest localities are also among the greenest ones.
The population in the smallest localities (200-499 inhabitants) had 2 000 m2 green space per person on average. This can be compared with the largest localities (100 000 inhabitants or more), where the corresponding green space was 192 m2 per person on average.
Most of the green space was public
On average, about 62 percent of the total green space in localities in 2020 was available for the public. The remaining 38 percent of the total green space in localities was linked to private residential gardens, or inaccessible to the public due to different types of restrictions.
Access to green area within 200 metres for 95 percent of urban population
On average, 95 percent of the urban population had access to at least one green area within 200 metres of their home in 2020. Proximity to green areas differed only slightly between large and small localities. Nor were there any major differences between genders or age groups.
Challenges in measuring changes over time
There is a strong demand for data to measure how urban green space changes over time. Measuring greenery in urban environments in a consistent way across time and space involves significant technical and methodological challenges.
Currently, the statistics are not designed for direct and accurate comparisons over time, as there is a considerable margin of uncertainty in the data. In other words, increases and decreases over time do not necessarily reflect actual changes on the ground, but rather technical and methodological factors. Statistics Sweden is currently working to identify complementary measurement methods that are better suited for time series and comparisons over time.
Definitions and explanations
Green space
Refers to all types of green spaces that constitute the total green structure within the locality border, such as public parks, open lawns, and other wooded or grassland spaces, green spaces abandoned during construction, residential gardens, green spaces between multi-dwelling buildings or industrial buildings, and green thoroughfares between roads, and so on. Green space breaks down into the subcategories ‘open land’ and ‘forest’.
Green area
Refers to an area with connected green spaces of at least 0.5 hectares that are accessible to the public. Pastures are classified as green areas, but arable land is not. Green areas are delimited geographically within a locality and within a three-kilometre boundary outside the locality border. In the statistics, green areas are grouped by sizes 0.5-3 hectares, 3-10 hectares, and 10 hectares and more. The smallest study domain is 0.5 hectares.
Publication
A more detailed report of this survey is published in the report Green space and green areas in urban areas 2020 (in Swedish, pdf)
Statistical Database
More information is available in the Statistical Database
Feel free to use the facts from this statistical news but remember to state Source: Statistics Sweden.