Producer and Import Price Index, July 2024
Price decreases in all markets in July 2024
Statistical news from Statistics Sweden 2024-08-27 8.00
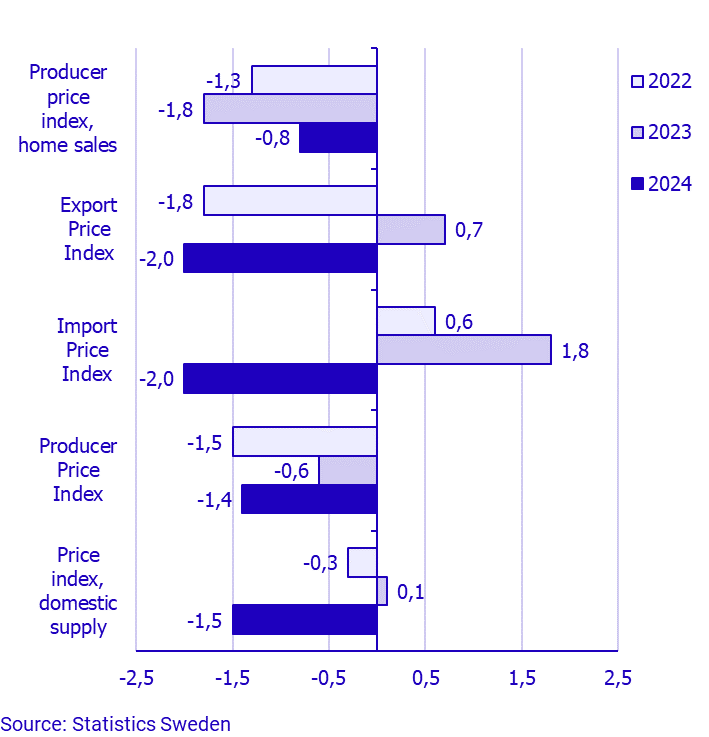
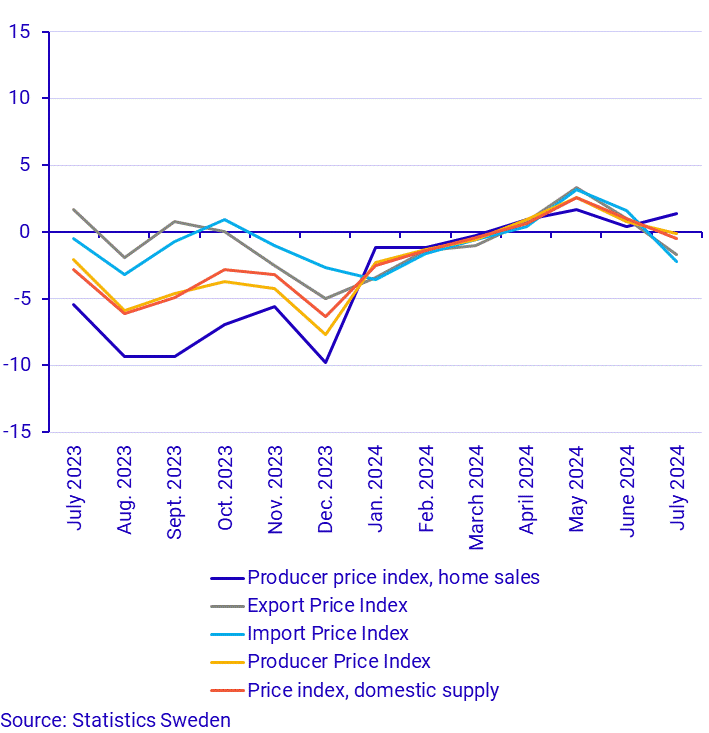
The Producer Price Index decreased by 1.4 percent in July compared to June 2024. On both the export and import market prices decreased by 2.0 percent. On the domestic market, prices decreased by 0.8 percent. The annual rate according to the Producer Price Index was -0.1 percent in July (0.8 percent in June).
In brief
- The annual rate of the Producer Price Index excluding energy-related products decreased from 2.8 percent in June to 0.8 percent in July.
- The largest negative contribution to the domestic market, compared to June 2024, came from trade services of electricity.
- The annual rate for consumer goods in Price Index for Domestic Supply decreased from 1.8 percent in June to -0.5 percent in July.
| Total: SPIN B–E* | Change, percent (monthly) |
Change, percent (yearly) |
|---|---|---|
| June 2024– July 2024 |
July 2023– July 2024 |
|
| Producer Price Index, home sales | ‑0.8 | 1.4 |
| Export Price Index | ‑2.0 | ‑1.7 |
| Import Price Index | ‑2.0 | ‑2.2 |
| Producer Price Index | ‑1.4 | ‑0.1 |
| Price Index for domestic supply | ‑1.5 | ‑0.5 |
*Products from mining and quarrying, manufactured products, electricity, gas, heating, cooling, water and waste collection.
Changes in the last month
The monthly rate of change was negative in all markets (domestic, export and import markets) in July. This resulted in a negative monthly rate of change for both Producer Price Index and Price Index for Domestic Supply during the same period.
The largest negative contribution in the domestic market came from lower prices on trade services of electricity. Prices also fell within basic precious and other non-ferrous metals. This downturn was offset by higher prices on wood and products of wood.
On the export market the main negative contribution came from lower prices on other machinery and equipment. Prices also fell within motor vehicles, trailers and semi-trailers, generation of electricity, chemicals and chemical products, computer, electronic and optical products, rubber and plastic products as well as basic precious and other non-ferrous metals. This downturn was offset by higher prices on pulp, refined petroleum products and other electronic and electric wires and cables.
The main contribution to the decrease on the import market came from lower prices on computer, electronic and optical products. Prices also fell within chemicals and chemical products, electrical equipment, other machinery and equipment, motor vehicles, trailers and semi-trailers as well as several other product groups.
| Product group according to SPIN 2015 | Largest contributions, in percentage points, to total percentage change, June 2024– July 2024 |
||||
|---|---|---|---|---|---|
| Producer Price Index, home sales |
Export Price Index |
Import Price Index |
|||
| 10 | Food products | ‑0.1 | |||
| 16 | Wood and products of wood | 0.1 | |||
| 17.11 | Pulp | 0.1 | |||
| 19.2 | Refined petroleum products | 0.1 | ‑0.1 | ||
| 20 | Chemicals and chemical products | ‑0.2 | ‑0.2 | ||
| 22 | Rubber and plastic products | ‑0.1 | ‑0.1 | ||
| 23 | Other non-metallic mineral products | ‑0.1 | |||
| 24.1 | Basic iron and steel | ‑0.1 | |||
| 24.4 | Basic precious and other non-ferrous metals | ‑0.1 | ‑0.1 | ‑0.1 | |
| 26 | Computer, electronic and optical products | ‑0.2 | ‑0.3 | ||
| 27 | Electrical equipment | ‑0.2 | |||
| 27.32 | Other electronic and electric wires and cables | 0.1 | |||
| 28 | Other machinery and equipment | ‑0.4 | ‑0.2 | ||
| 29 | Motor vehicles, trailers and semi-trailers | ‑0.3 | ‑0.2 | ||
| 35.11A | Generation of electricity | ‑0.3 | ‑0.1 | ||
| 35.14 | Trade services of electricity | ‑0.7 | |||
Changes in the last year
The annual rate for the domestic market was 1.4 percent in July (0.4 percent in June). The annual rate for the export market was -1.7 percent during the same period (1.0 percent in June). On the import market, the annual rate in July was -2.2 percent (1.6 percent in June).
The annual rate of the Producer Price Index was -0.1 percent in July. Compared with July 2023, prices fell by 7.1 percent on energy-related products. Prices increased by 1.4 percent on consumer goods and increased by 1.1 percent on capital goods. The annual rate of the Producer Price Index excluding energy-related products was 0.8 percent.
The annual rate of the Price Index for Domestic Supply was -0.5 percent in July. Compared with July 2023, prices fell by 4.5 percent on energy-related products. Prices decreased by 0.5 percent on consumer goods and increased by 0.7 percent on capital goods. The annual rate of the Price Index for Domestic Supply excluding energy-related products was 0.2 percent.
Changes in exchange rates
An appreciation or depreciation of the Swedish currency lowers or raises export and import prices in Swedish kronor. Prices at the producer and import stages are converted from foreign currencies to Swedish kronor according to Swedish Customs’ exchange rates.
| Currency | Change, percent (monthly) |
Change, percent (yearly) |
|---|---|---|
| June 2024– July 2024 |
July 2023– July 2024 |
|
| DKK | 3.7 | 5.5 |
| EUR | 3.8 | 5.4 |
| GBP | 2.7 | 3.9 |
| NOK | 1.7 | 2.2 |
| USD | 2.7 | 3.6 |
A positive number means that the Swedish krona was strengthened against that currency.
Definitions and explanations
The Producer Price Index home sales (HMPI) measures changes in Swedish producers’ prices of goods manufactured and sold in Sweden.
The Export Price Index (EXPI) measures changes in Swedish producers’ prices of goods manufactured in Sweden and sold outside Sweden, both within and outside the EU.
The Import Price Index (IMPI) measures changes in the prices of imports of goods into Sweden.
The Producer Price Index (PPI) measures changes in the prices of Swedish producers’ total sales, obtained by combining the HMPI and the EXPI.
The Price Index for Domestic Supply (ITPI) measures changes in the prices of goods sold in Sweden, obtained by combining the HMPI and the IMPI.
Next publishing will be
Statistics for August will be published on 2024-09-25 at 08:00.
Statistical Database
More information is available in the Statistical Database
Feel free to use the facts from this statistical news but remember to state Source: Statistics Sweden.