Community Innovation Survey, 2022-2024 (correction 2025-12-16)
Larger share of innovative enterprises 2022–2024
Statistical news from Statistics Sweden 2025-11-13 8.00
58 percent of Swedish enterprises were innovative while 61 percent carried out innovation activities during 2022–2024. The share of enterprises with innovation activities increased in all industries 2022–2024 compared to 2020-2022. At the same time, the enterprises’ expenditures for innovation activities excluding research and development decreased in 2024.
Note that the values regarding companies’ innovation expenditures for 2024 have been revised. Read more under the section “Correction of the statistics.”
During the reference period 2022-2024, the share of innovative and the share of innovation active enterprises were 58 and 61 percent, respectively. This was an increase of 10 and 11 percentage points, compared to the period 2020-2022. An enterprise is innovation active if it, during the reference period, has worked on an innovation that has either been introduced, is still under development, or has been terminated. An innovative enterprise, in turn, means that the enterprise has introduced a new or significantly improved product or process.
The share of innovation active enterprises has historically been greater in the service sector than in the industry sector, which was also the case during 2022-2024. 67 percent of all enterprises in the service sector had conducted some form of innovation activity during the reference period, compared to 54 percent in the industry sector. The share of innovation active enterprises increased by 9.8 and 10.9 percentage points respectively for the service and industry sectors, compared to the previous reference period.
Service sector more innovation active than the industry sector
| 2020-2022 | 2022-2024 | |
|---|---|---|
| Industry sector | 43% | 54% |
| Service sector | 57% | 67% |
| Total | 50% | 61% |
The share of innovative and innovation active enterprises increased in all industries. The greatest increase occurred in mines and quarries (NACE 05-09) where the share of innovative enterprises increased from 32 percent 2020-2022 to 58 percent 2022-2024. The industry with the greatest share of innovative enterprises was institutes for scientific research and development (NACE 72), which is often in the top of innovation surveys, where the share of innovative enterprises was 81 percent. The industry with the lowest share of innovative enterprises was land, sea and air transport (NACE 49-51), where 41 percent of enterprises were innovative.
Large differences in the share of innovative enterprises between industries
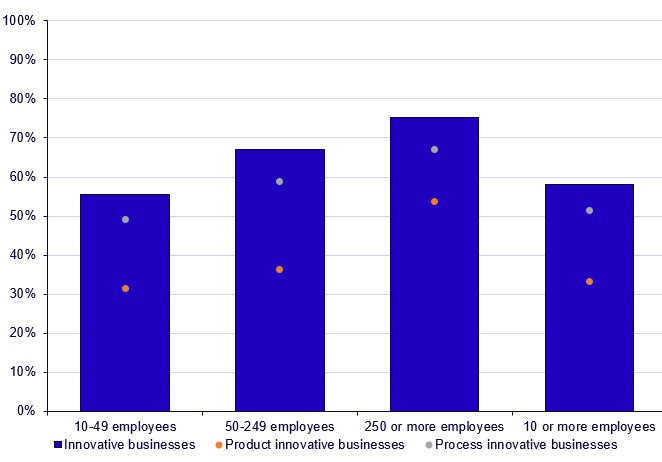
Small enterprises (10-49 employees), which was the largest group in terms of number of enterprises, had the lowest share of innovative enterprises compared to medium-sized enterprises (50-249 employees) and large enterprises (250 employees or more). The share of innovative enterprises among small enterprises was 55 percent. In comparison, the share of innovative enterprises among medium-sized and large enterprises was 67 and 75 percent, respectively. Similar to previous reference periods, process innovations continue to be the most common type of innovation. 51 percent of Swedish enterprises introduced a process innovation during 2022-2024, while 33 percent introduced a product innovation.
Large enterprises were more innovative than small
Product innovations more important for smaller enterprises
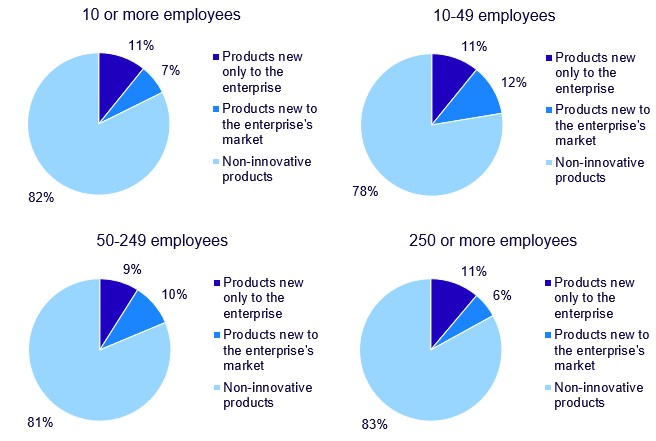
Product innovations, which concerns both new and significantly improved goods and services, generated 18 percent of the turnover among product innovative enterprises during 2024. An innovation can either be new only to the enterprise itself, or new to both the enterprise and the enterprise’s market. An innovation being new to the enterprise’s market indicates a uniqueness in the innovation that the enterprise offers. It is common that activities such as marketing and uptake of innovative products happen during periods longer than a year and there could naturally be a delay between the introduction of a product to the market and turnover being generated for the enterprise. Product innovations that are introduced to the market late in the reference period will therefore likely not yet have contributed to turnover.
The share of the turnover from product innovations that were new only to the enterprise was relatively similar between the size classes, between 9 and 11 percent. There was, however, a greater difference between the size classes in the share of turnover from product innovations that were new both to the enterprise and the enterprise’s market. The share of the turnover from product innovations that were new to the market was 12 percent among the small innovative enterprises, compared to 6 percent among the large innovative enterprises. In total, the share of the turnover from product innovations among small and large innovative enterprises was 22 and 17 percent, respectively, which could indicate that the novelty of innovations is more important the smaller the enterprise is. The share of the turnover from product innovations decreased compared to the reference year 2022. 25 percent of the total turnover was generated by product innovations among small innovative enterprises in 2022. The corresponding number among the large innovative enterprises was 23 percent in the reference year 2022.
Unique products more important for small enterprises
More enterprises were able to accommodate their innovation needs
57 percent of the innovation active enterprises stated that they had no need for additional innovation activities during 2022-2024, compared to 50 percent in 2020-2022. The share of innovation active enterprises that stated that they did not conduct additional innovation activities due to a lack of resources, or other reasons than a lack of resources, decreased during 2022-2024 by 2.5 and 4.3 percentage points respectively, compared to 2020-2022. Thus, there was a lower share of innovation active enterprises that experienced a need of additional innovation activities during 2022-2024 compared to 2020-2022, which could indicate that more innovation active enterprises had a better ability to accommodate their innovation needs during the reference period. 86 percent of the non-innovation active enterprises stated that they had no need for additional innovation activities, which is the same level as in 2020-2022.
Fewer innovation active enterprises in need of additional innovation activities
| Lacking resources | Other reasons than lacking resources | No need | ||||
|---|---|---|---|---|---|---|
| 2020-2022 | 2022-2024 | 2020-2022 | 2022-2024 | 2020-2022 | 2022-2024 | |
| Innovation active | 28% | 25% | 22% | 18% | 50% | 57% |
| Non-innovation active | 6% | 5% | 8% | 9% | 86% | 86% |
Improved reputation was the most important driver behind innovations with environmental benefits
A majority of Swedish innovative enterprises (61 percent) introduced innovations with environmental benefits during 2022-2024. The most common environmental benefit was that the innovation led to reduced energy use or reduced CO2 emissions for the enterprise, stated by 37 percent. The share of innovative enterprises that introduced an innovation with environmental benefits increased with the size of the enterprises. 81 percent of large innovative enterprises introduced an innovation with environmental benefits. The corresponding shares for medium-sized and small enterprises were 66 and 59 percent, respectively. The most important driver for innovations with environmental benefits was improved reputation for the enterprise. 69 percent of the enterprises that introduced an innovation with environmental benefits stated that improved reputation for the enterprise had high or medium importance for introducing innovations with environmental benefits. In contrast, only 55 percent of the enterprises stated that government grants, subsidies, or other financial incentives were relevant for innovations with environmental benefits, which was the lowest share of all drivers.
Economic incentives the least important driver behind innovations with environmental benefits 2022-2024
| Drivers | High or medium | low | Not relevant |
|---|---|---|---|
| Improving the enterprise's reputation | 69% | 14% | 16% |
| Voluntary actions or initiatives for environmental good practice within your sector | 60% | 21% | 19% |
| Existing environmental regulations | 56% | 22% | 22% |
| Need to meet requirements for public procurement contracts | 52% | 20% | 28% |
| Current or expected market demand for environmental innovations | 49% | 24% | 26% |
| Environmental regulations or taxes expected in the future | 47% | 25% | 28% |
| High cost of energy, water or materials | 46% | 27% | 27% |
| Existing environmental taxes, charges, or fees | 44% | 31% | 26% |
| Government grant, subsidies, or other financial incentives for environmental innovations | 20% | 34% | 45% |
Correction of the statistics
The statistics regarding enterprises’ innovation expenditures for 2024 have been corrected after an error was discovered in these figures. The error occurred due to incorrect data being used for this text. Other parts of the text and other published material are not affected by this error. The text below and the accompanying table on enterprises’ innovation expenditures have been corrected.
Enterprises’ expenses related to innovation has decreased
The enterprises are asked to state their expenditures related to innovation for the reference year 2024. The total innovation expenditure excluding research and development in 2024 was SEK 57.2 billion in current prices, a decrease of 3.3 percent, or 1.9 billion SEK, compared to 2022. Inflation has been relatively high between 2022 and 2024 and adjusted for fixed prices, innovation expenditures have decreased by 11.3 percent, equal to SEK 7.3 billion. The small enterprises had the greatest decrease in innovation expenditures in relative terms, with a decrease of 20.4 percent, or SEK 3.0 billion in 2024 compared to 2022. Thus, these enterprises accounted for 41 percent of the decrease in innovation expenditures, even though they only accounted for 23 percent of the innovation expenditures in 2022. The medium-sized and large enterprises decreased their expenditures with SEK 0.5 billion and SEK 3.8 billion, or 3.8 and 10.3 percent, respectively, compared to 2022.
The medium-sized and large enterprises experienced a sharp increase in expenditures on capital goods in 2024 compared to 2022, increasing by 52 and 79 percent, or SEK 0.7 billion and SEK 4.7 billion, respectively. In contrast, the small enterprises decreased their expenditures on capital goods by 26 percent, or SEK 0.8 billion.
The share of innovative and innovation active enterprises has thus increased during the period 2022-2024 even though their innovation expenses decreased in 2024. When comparing innovation activities with innovation expenses it’s important to keep in mind that the reference periods differ. The statistics regarding innovation activities are based on a three-year period, 2022-2024, while the expenses are based on 2024 alone.
Small enterprises had the biggest impact on decreased innovation expenses
| Small enterprises | Middle-sized enterprises | Large enterprises | Total | ||||||
|---|---|---|---|---|---|---|---|---|---|
| 2022 | 2024 | 2022 | 2024 | 2022 | 2024 | 2022 | 2024 | Change | |
| Own personelll | 8253 | 6185 | 7311 | 6618 | 20 883 | 14 857 | 36 447 | 27 660 | -24% |
| Services or materials | 2019 | 2373 | 2633 | 2056 | 8422 | 6267 | 13 073 | 10 697 | -18% |
| Capital goods | 3164 | 2351 | 1430 | 2169 | 5983 | 10 730 | 10 557 | 15 250 | 44% |
| Other expenditures | 1092 | 657 | 1374 | 1423 | 1887 | 1502 | 4353 | 3582 | -18% |
| Total | 14 528 | 11 556 | 12 747 | 12 267 | 37 175 | 33 355 | 64 450 | 57 189 | -11% |
Comments
Due to roundingerrors some shares do not sum to 100