New registrations of passenger cars and lorries in Sweden, July 2018:
Registration of new cars decreased in July, as expected, with 47.3 percent
Statistical news from Statistics Sweden 2018-08-02 9.30
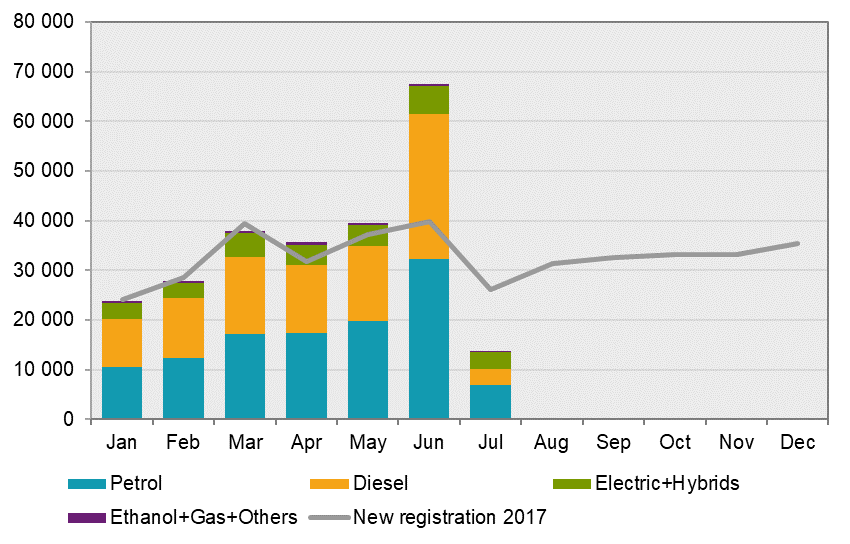
In July 2018, 13 798 passenger cars were newly registered, down 47.3 percent from July last year. The large decrease is a consequence of the all-time high in new registrations in June. This, according to Transport Analysis’ monthly official statistics on newly registered vehicles.
On July 1, the new Bonus Malus system was introduced for newly registered passenger cars, light lorries and light buses. The purpose is to increase the amount of environmentally adapted vehicles and achieve the goal of a fossil-free fleet. Environmentally adapted vehicles, in Swedish called “klimatbonusbilar” (climate bonus cars), with no or very low carbon dioxide emissions of up to 60 g/km, are awarded a bonus of up to SEK 60 000. Cars that can be powered by gas, LPG excluded, receive a fixed bonus amount of SEK 10 000, regardless of their carbon dioxide emissions. Malus entails an increased vehicle tax for the first three years for petrol and diesel vehicles.
This first month with the new system shows that passenger cars powered by electricity (hybrid electric and plug-in hybrid), ethanol or gas accounted for 27 percent of new registrations in July compared with only 12 percent in the first half of the year. Newly registered passenger cars defined as a “klimatbonusbil” accounted for 19 percent in July.
The higher vehicle taxes on newly registered petrol and diesel cars introduced with the Bonus Malus system resulted in many cars being registered before 1 July. As a result, new registrations of such passenger cars fell by 38 and 75 percent, respectively, in July, compared with the same month last year.
Among newly registered cars, 12 813 were of the 2016–2018 model years, and 985 were older models. During the month, 23 723 passenger cars were deregistered, leading to a reduction in the total passenger car fleet of 9 925 vehicles.
Sixty-two percent of cars were registered by businesses and organisations, of which businesses in the car retail trade accounted for 25 percent of total new registrations. Among cars registered by private persons, men accounted for 66 percent and women accounted for 34 percent of registrations.
The Bonus Malus system includes light but not heavy lorries, which is apparent from the number of newly registered lorries. In July, 1 368 lorries were newly registered, a decrease of 56.4 percent compared with the same month last year. Among newly registered lorries, 935 were light lorries with a weight up to 3.5 tonnes, which is a decrease of 65.6 percent, and 433 were heavy lorries with a weight over 3.5 tonnes, which is an increase of 1.6 percent compared with July 2017.
New registrations between January and July 2018
So far this year, new registrations of passenger cars increased by 8.3 percent compared with the same period last year. A total of 98 715 diesel cars have been registered so far this year, a decrease of 14.8 percent compared with the same period last year.
Passenger cars that can be powered by electricity (hybrid electric and plug-in hybrid), ethanol or gas accounted for 12.6 percent of new registrations this year, compared with 9.5 percent in the same period last year.
| Type of vehicle | January–July 2018 | January–July 2017 | Changes percent |
|---|---|---|---|
|
Passenger cars
|
245 985 | 227 036 | 8.3 |
|
of which petrol
|
116 282 | 89 437 | 30.0 |
|
of which diesel
|
98 715 | 115 913 | ‑14.8 |
|
of which electric
|
2 804 | 2 512 | 11.6 |
|
of which hybrid electric
|
12 617 | 10 106 | 24.8 |
|
of which plug-in hybrid
|
12 834 | 6 953 | 84.6 |
|
of which ethanol/ethanol flexi-fuel
|
504 | 563 | ‑10.5 |
|
of which gas /gas bi-fuel
|
2 214 | 1 523 | 45.4 |
|
|
|||
|
Motorhomes (subset of passenger cars)
|
7 037 | 5 399 | 30.3 |
|
Lorries
|
47 351 | 36 019 | 31.5 |
|
Busses
|
433 | 522 | ‑17.0 |
|
Trailers (excl. caravans)
|
31 607 | 35 260 | ‑10.4 |
|
Caravans
|
2 921 | 3 276 | ‑10.8 |
|
Tractors
|
4 826 | 4 612 | 4.6 |
|
Motorcycles
|
9 575 | 8 924 | 7.3 |
|
Class 1 mopeds
|
6 343 | 9 605 | ‑34.0 |
|
Snowmobiles
|
4 835 | 4 480 | 7.9 |
|
Terrain vehicles
|
2 505 | 2 919 | ‑14.2 |
Databases containing information for passenger cars on the county/municipality level and fuel for the years 2006–2018 are available in the Statistical database.
Transport Analysis is the government agency responsible for the statistics and Statistics Sweden has produced the statistics at its behalf. For detailed information on new registrations, please see "Monthly vehicle statistics" available at Transport Analysis or Statistics Sweden.
New registrations comprise all vehicles that were entered into the register during the month. These registrations differ from new registrations in BIL Sweden’s reports. BIL Sweden's data only contains data on cars of the latest three model years and cars that are not directly imported.
Key Facts about Transport Analysis
Transport Analysis is the government agency that analyses and evaluates Swedish transport policy and is responsible for official statistics in the field of transport. Transport Analysis also produces background data for transport policy decision-makers and promotes socioeconomically efficient and long-term sustainable transport services provision throughout Sweden.
Next publishing will be
New registrations in August will be published on 4 September at 09:30.
Statistical Database
More information is available in the Statistical Database
Feel free to use the facts from this statistical news but remember to state Source: Statistics Sweden.