Third quarter 2025
Greenhouse gas emissions from Sweden’s economy decreased in the third quarter of 2025
Statistical news from Statistics Sweden 2026-01-29 8.00
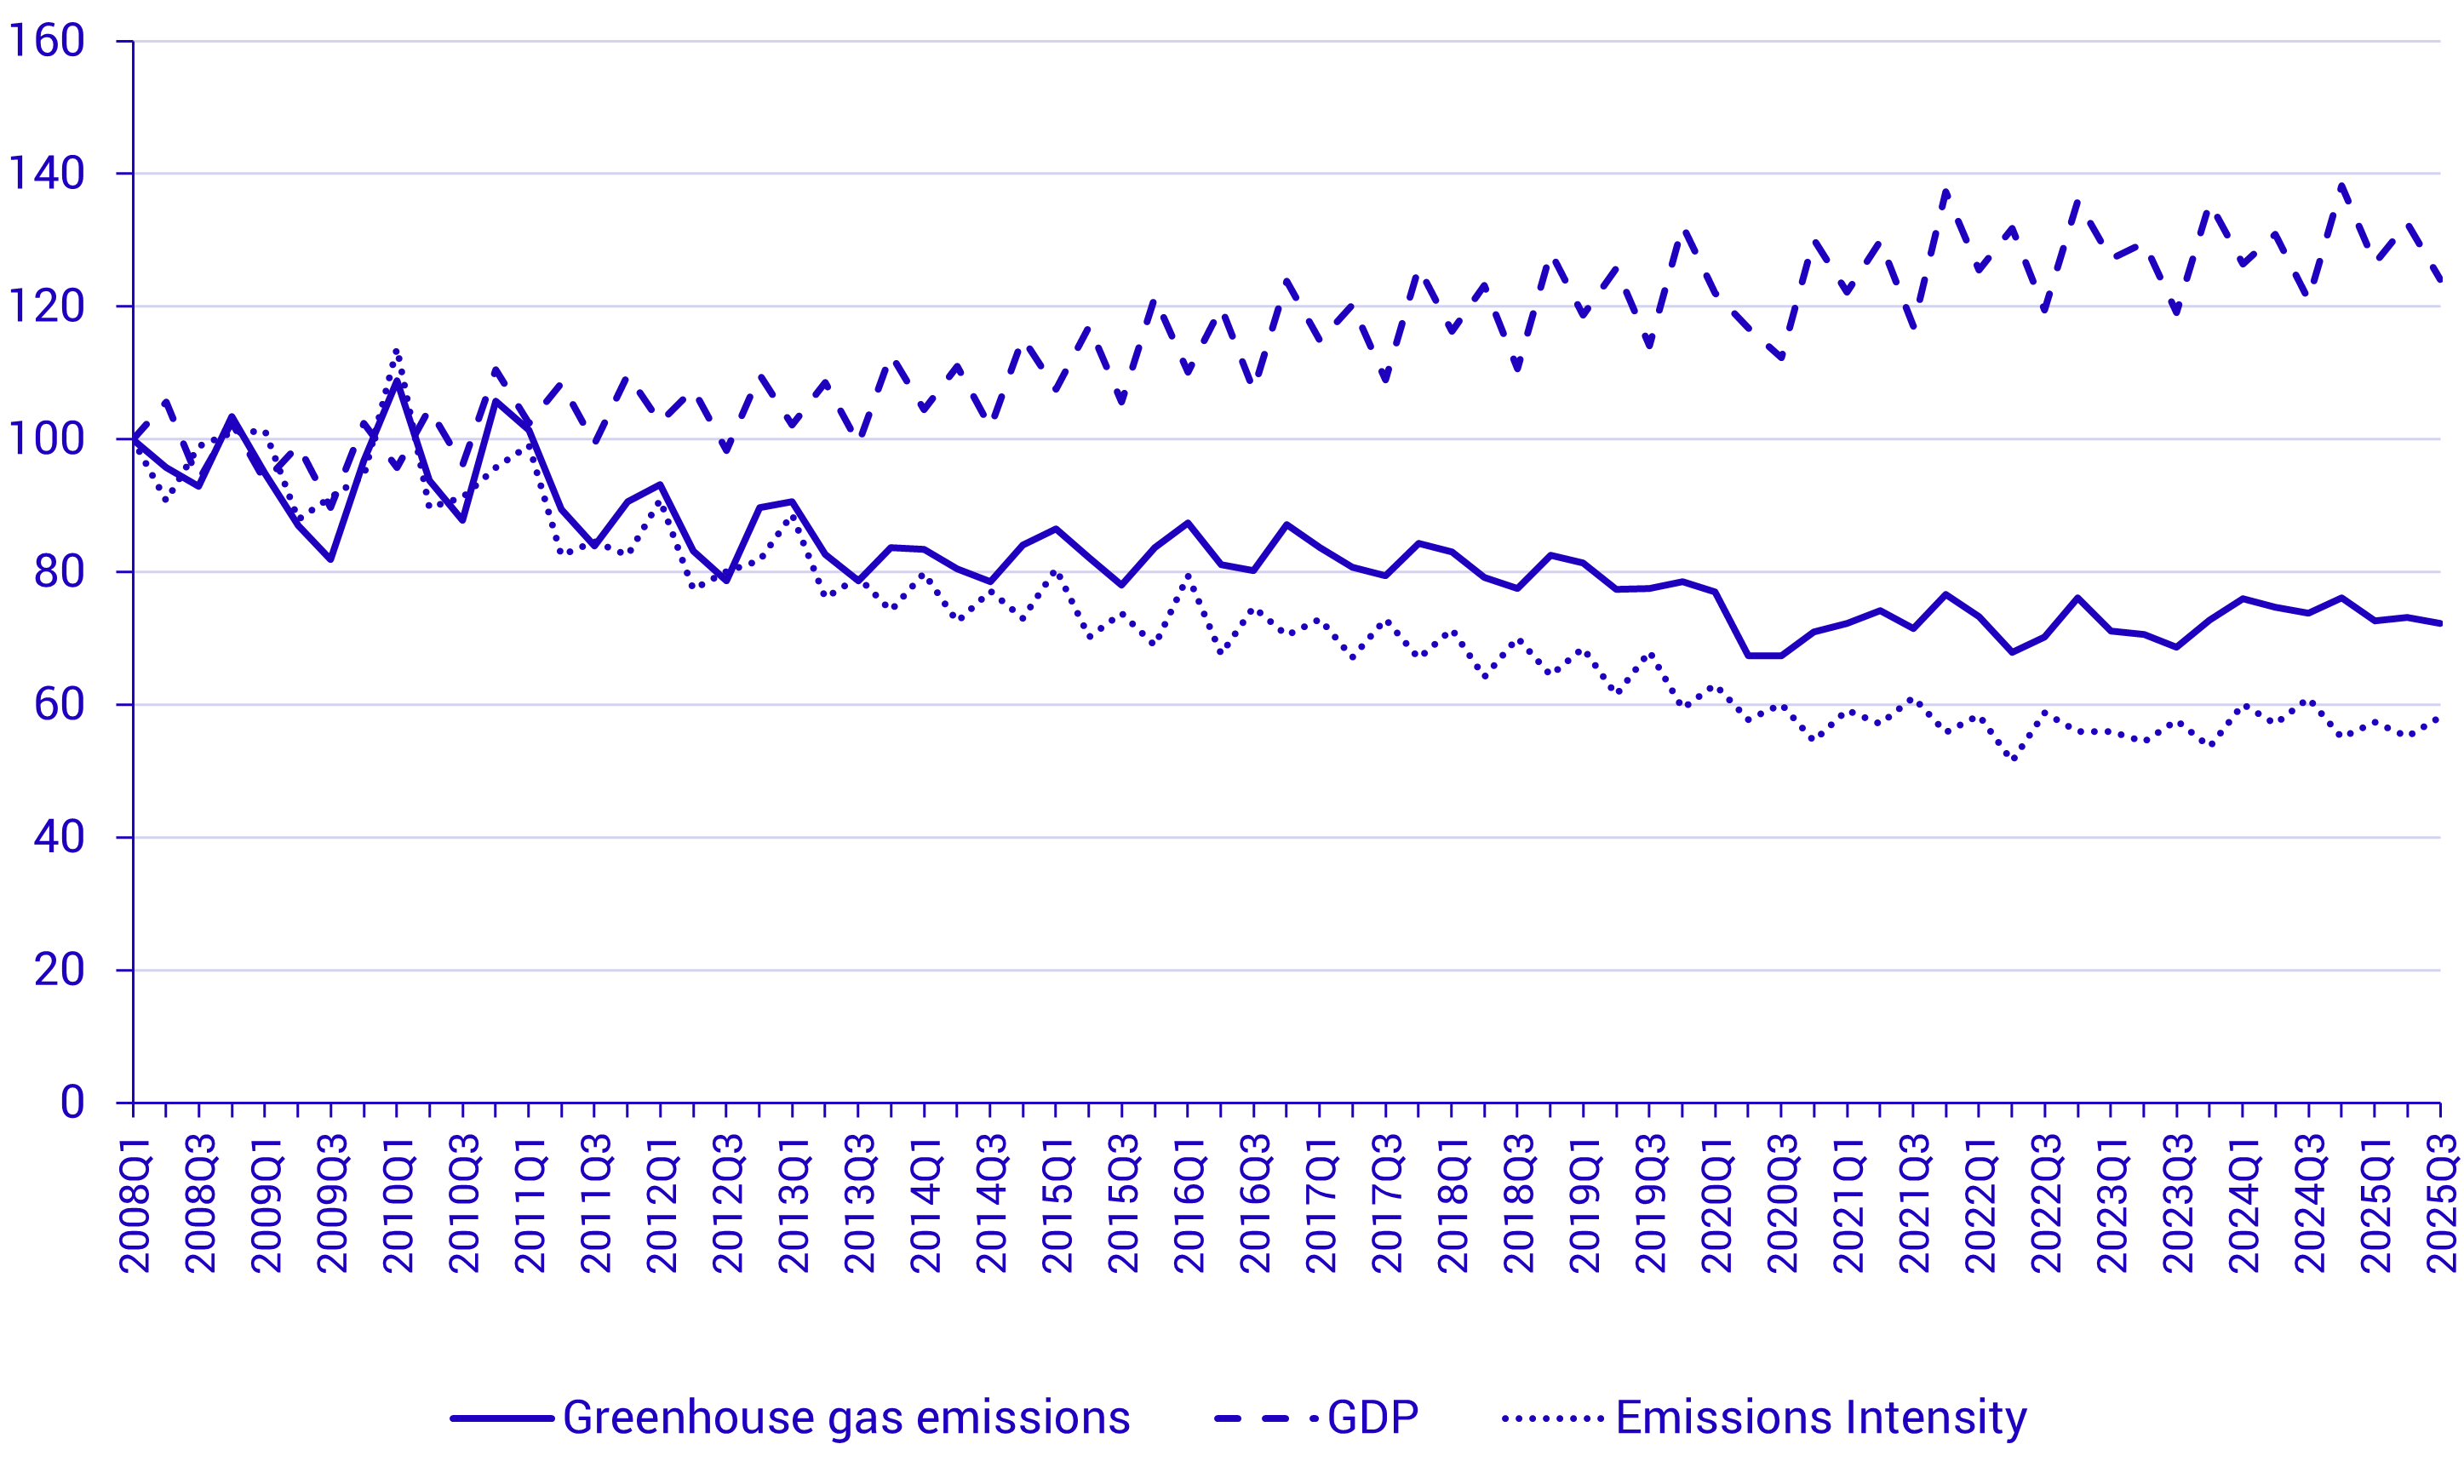
Greenhouse gas emissions from the Swedish economy amounted to 12.4 million tonnes in the third quarter of 2025, according to preliminary figures from Statistics Sweden. This represents a 2.0 per cent decrease compared with the same quarter in 2024. Over the same period, GDP at constant prices increased by 2.6 per cent, resulting in a 4.5 per cent reduction in emission intensity. From a longer-term perspective, greenhouse gas emissions have increased by 5.1 percent compared to the third quarter of 2023.
Quarterly statistics from Statistics Sweden’s environmental accounts, report preliminary air emissions from Sweden’s economy, including households. The greenhouse gas emissions are presented as the sum of individual gases measured in carbon dioxide equivalents.
One underlying reason for the decrease in emissions is that deliveries of fossil diesel fell during the third quarter of 2025 compared with the corresponding quarter of 2024. At the same time, deliveries of HVO (biodiesel) increased compared with 2024. This is according to Statistics Sweden’s data on fuel deliveries to the Swedish market (Monthly Fuel, Gas and Stock Statistics).
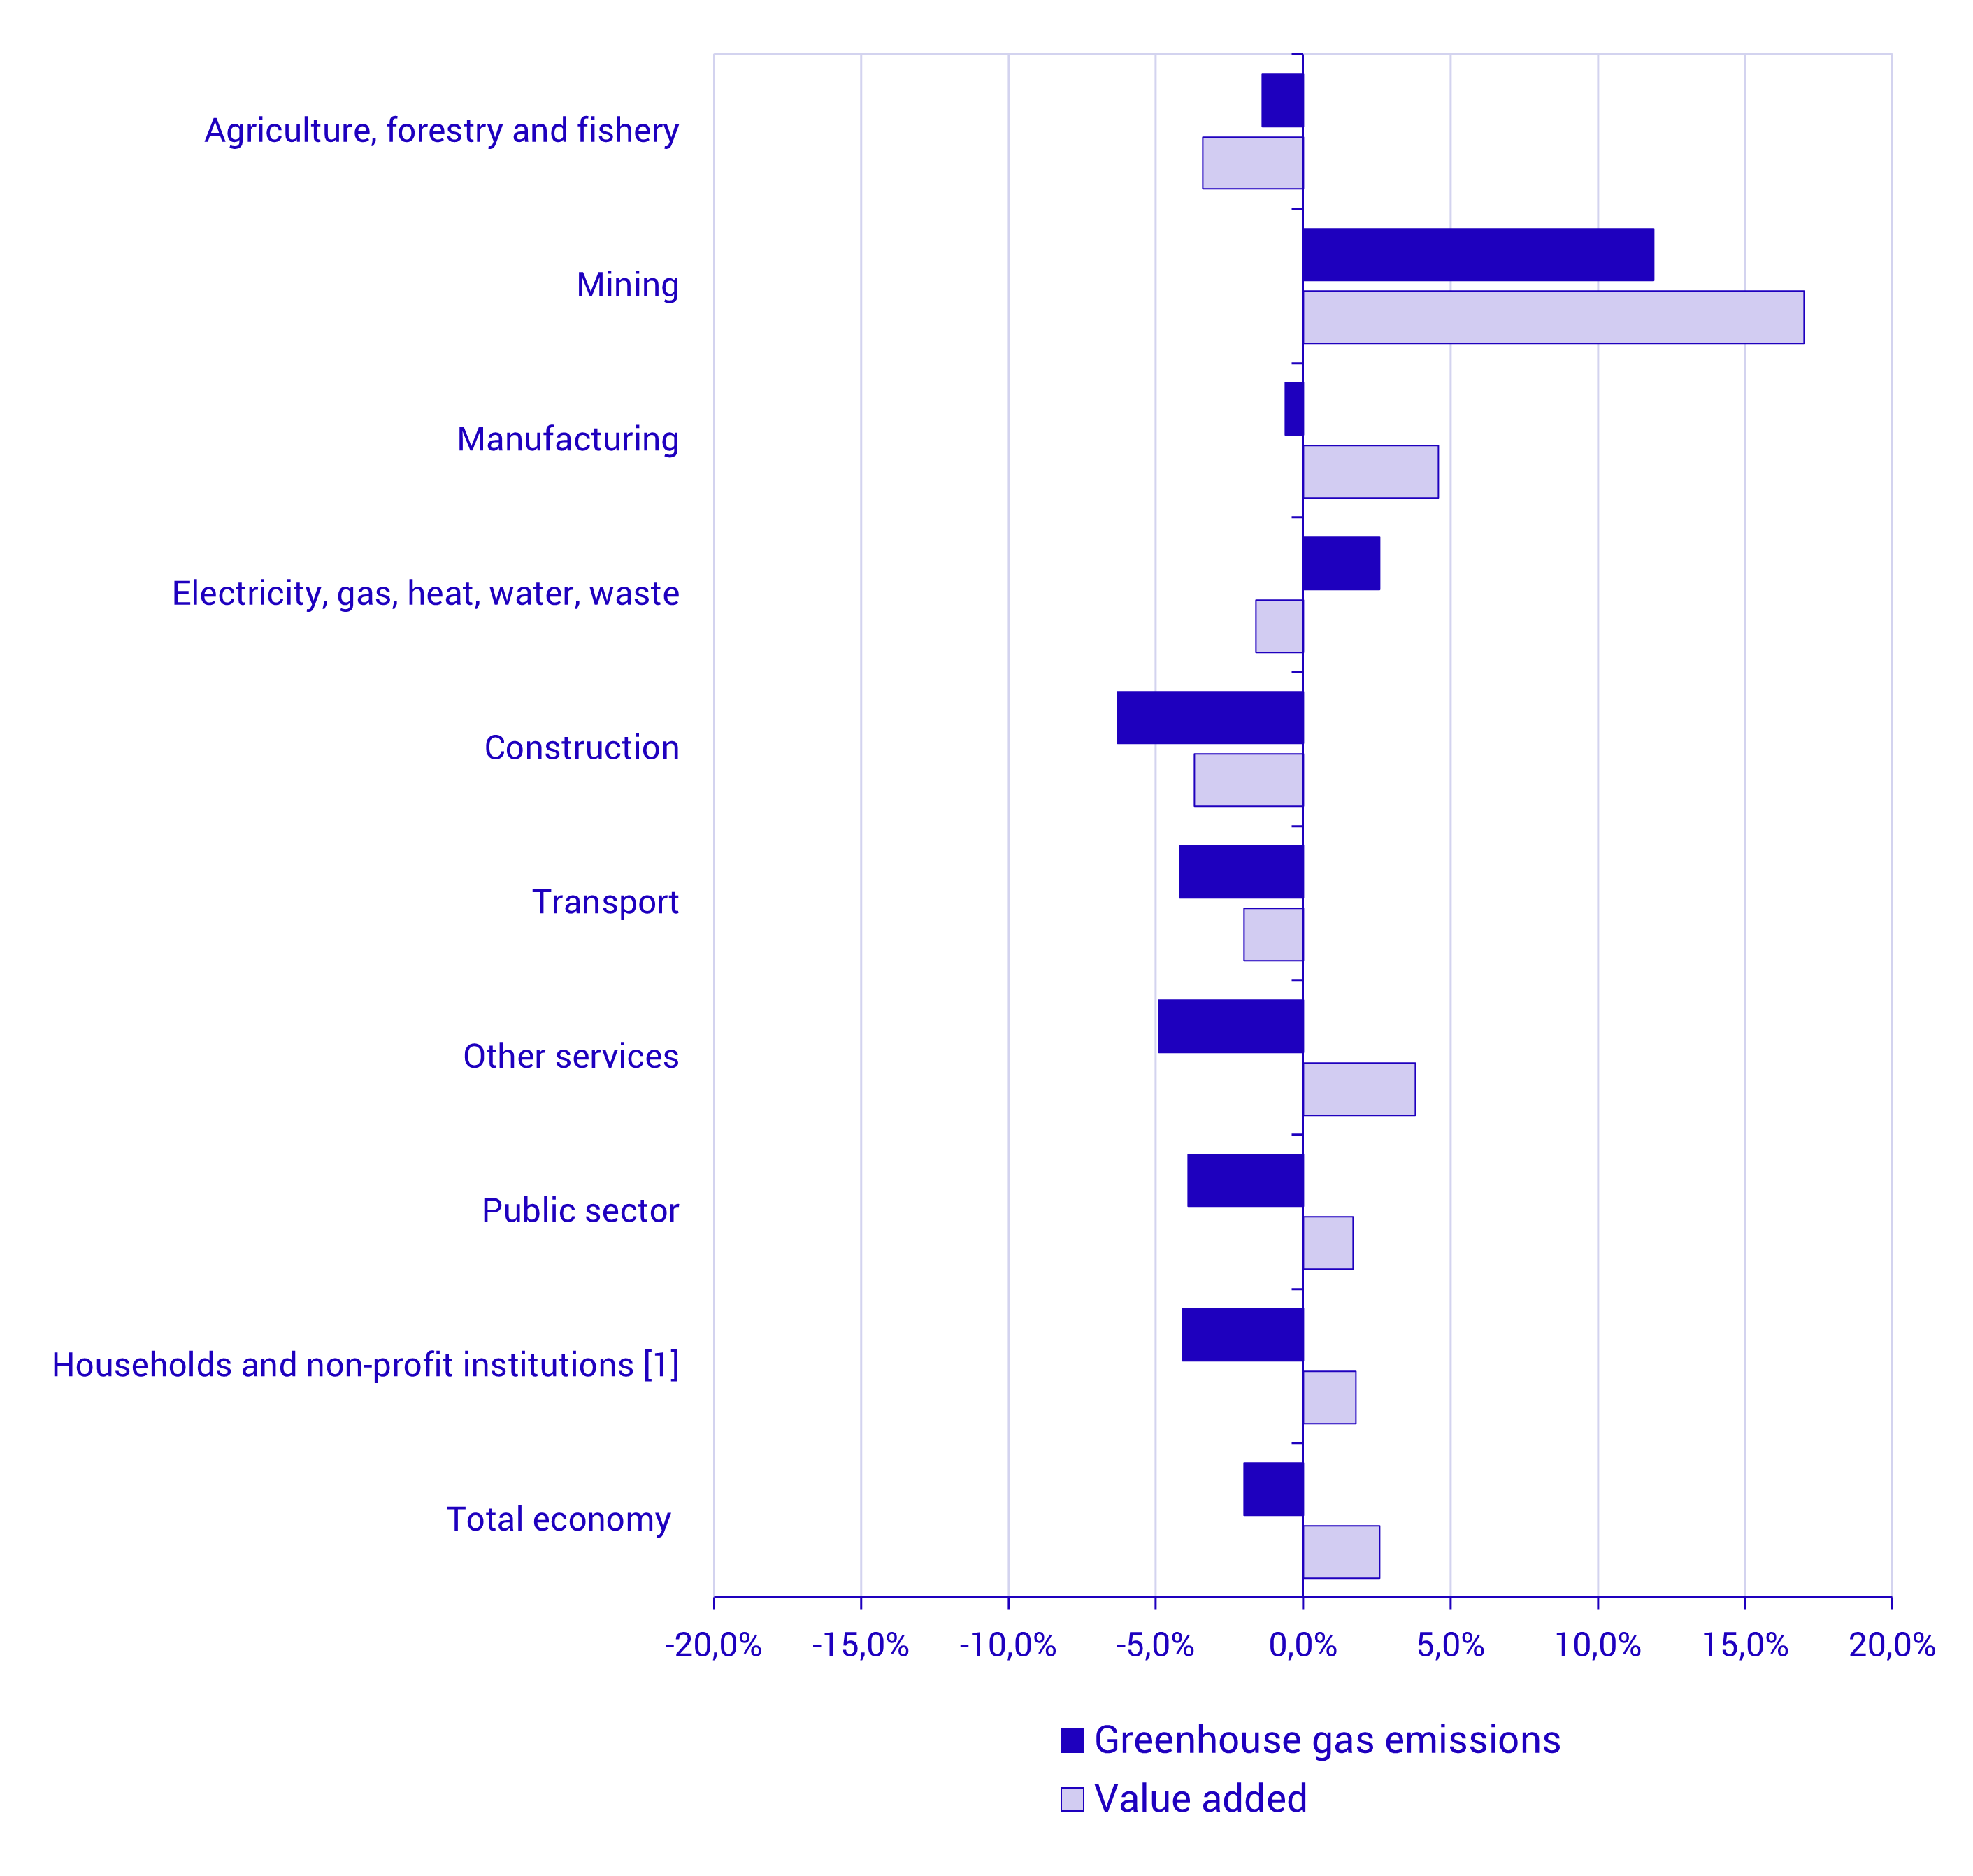
Compared with the third quarter of 2024, emissions from Households and non-profit institutions decreased by 88 kilotonnes of carbon dioxide equivalents (-4.1 per cent). Emissions from the Transport industry fell by 98 kilotonnes of carbon dioxide equivalents (-4.2 per cent), while emissions from the Mining and quarrying sector increased by 24 kilotonnes (11.9 per cent). Emissions also increased within the Electricity, gas, heating, water, sewage and waste management sector, by 29 kilotonnes (2.6 per cent).
Summary of developments in the third quarter of 2025
Unless otherwise stated, the percentage figures below refer to changes compared with the corresponding quarter of the previous year for each respective industry. Greenhouse gas emissions are reported in kilotonnes of carbon dioxide equivalents.
- Total emissions from the Swedish economy decreased by 260 kilotonnes, corresponding to a reduction of 0 per cent.
- Among the aggregated industries for which Statistics Sweden reports emissions, the largest absolute decrease occurred in the Transport industry. Emissions here fell by 98 kilotonnes of carbon dioxide equivalents, a decline of 2 per cent.
- The second-largest absolute decrease was recorded for Households and non-profit institutions, where emissions fell by 88 kilotonnes (1 per cent).
- Emissions increased in two of the aggregated industries: Mining and quarrying (up 24 kilotonnes, 9 per cent) and the Electricity, gas, heating, water, sewage and waste management sector (up 29 kilotonnes, 2.6 per cent).
Greenhouse gas emissions and value added (aggregated industries, NACE Rev. 2, not seasonally adjusted). Kilotonnes of carbon dioxide equivalents and SEK million in constant prices, reference year 2024.
Aggregated industries, NACE Rev. 2 |
Preliminary greenhouse gas emissions |
Preliminary value added |
||||
2025 Q3 |
Change compared with 2024 Q3 |
2025 Q3 |
Change compared with 2024 Q3 |
|||
Agriculture, forestry and fishery |
2 050 |
-29 |
-1,4% |
20 510 |
-732 |
-3,4% |
Mining |
230 |
24 |
11,9% |
10 409 |
1 512 |
17,0% |
Manufacturing |
3 311 |
-19 |
-0,6% |
191 354 |
8 430 |
4,6% |
Electricity, gas, heat, water, waste |
1 149 |
29 |
2,6% |
34 612 |
-560 |
-1,6% |
Construction |
513 |
-35 |
-6,3% |
80 271 |
-3 076 |
-3,7% |
Transport |
2 212 |
-98 |
-4,2% |
49 673 |
-1 009 |
-2,0% |
Other services |
807 |
-42 |
-4,9% |
706 176 |
25 558 |
3,8% |
Public sector |
84 |
-3 |
-3,9% |
260 565 |
4 347 |
1,7% |
Households and non-profit institutions [1] |
2 076 |
-88 |
-4,1% |
16 933 |
296 |
1,8% |
Total economy [2] |
12 431 |
-260 |
-2,0% |
1 535 095 |
38 986 |
2,6% |
Greenhouse gas emissions and economic development, GDP at market prices and in constant prices (reference year 2024), 2008 Q1 – 2025 Q3, Index 2008 Q1 = 100
Development of greenhouse gas emissions and value added. Percentage change between 2024 Q3 and 2025 Q3.
Definitions and explanations
What does the quarterly statistics show?
The quarterly statistics from Statistics Sweden’s environmental accounts report production-based air emissions by industry for the Swedish economy, including households. Production-based emissions refer to greenhouse gas emissions generated by Swedish economic actors. The statistics cover emissions from Swedish companies and individuals occurring both within and outside Sweden’s borders. Production-based emissions follow the same system boundary as the national economic statistics, the National Accounts.
For the transport industry, emissions generated by transport companies with economic residence in Sweden are included, regardless of where in the world these emissions occur. Correspondingly, emissions from foreign economic actors are excluded. For example, emissions from foreign airlines operating flights to, from or within Sweden are not included.
In accordance with the climate convention, biogenic carbon dioxide emissions from the combustion of biofuels are reported separately from fossil carbon dioxide emissions. In the statistics on total greenhouse gas emissions from the Swedish economy, biogenic emissions are excluded. This is because the extraction of biomass from forests and land (for example for the production of biofuels) is monitored within the land use sector (LULUCF) in Sweden’s reporting under international commitments such as the Paris Agreement. If the same quantities of carbon reported as biomass extraction were also reported as emissions from the combustion of biofuels, this would result in double counting. To ensure that all carbon dioxide emissions are accounted for, biogenic carbon dioxide emissions from the Swedish economy are therefore presented as a separate category.
When comparing quarters, readers should be aware of seasonal variations. For example, emissions from the Electricity, gas, heating, water, sewage and waste management sector tend to be higher during the colder months of the year, while households’ consumption of diesel and petrol is higher during the warmer months.
Greenhouse gases expressed in carbon dioxide equivalents are calculated as an aggregate of CO₂ (fossil), CH₄, N₂O, HFCs, PFCs and SF₆. The conversion factors (Global Warming Potential, GWP) used to calculate carbon dioxide equivalents are the same as those applied in Sweden’s climate reporting to the UNFCCC[1].
[1] IPCC, 2014: Climate Change 2014: Synthesis Report. Contribution of Working Groups I, II and III to the Fifth Assessment Report of the Intergovernmental Panel on Climate Change [Core Writing Team, R.K. Pachauri and L.A. Meyer (eds.)]. IPCC, Geneva, Switzerland, 151 pp, AR5 Synthesis Report - Climate Change 2014 (ipcc.ch).
Revisions
The OECD has not updated the statistics used to estimate emissions from air transport. While awaiting the resumption of publication, data for the corresponding quarters of the previous years have been reused.
Feel free to use facts from this statistical news article, but remember to cite the source: Statistics Sweden.