Environmental accounts – Emissions to air 2017
Biofuel use is increasing
Statistical news from Statistics Sweden 2019-03-28 9.30
The use of biomass in relation to total fuel use in the Swedish economy has increased from 37 percent in 2008 to 47 percent in 2017. Greenhouse gas emissions by the Swedish economy and households decreased by about 12 percent in the period 2008–2017. In the same period, the Swedish economy grew by 17 percent. However, the decrease in emissions has slowed in recent years, and in 2017 emissions increased compared with the previous year.
The Environmental Accounts at Statistics Sweden publishes emissions to air by the Swedish economy and households, and fossil and biofuel use. Final annual statistics for 2017 are now available.
Biofuel use is gradually increasing
Energy accounts, which describe energy fuel use in different industries, also form part of the Environmental Accounts. The manufacturing industry is the largest user of energy and accounts for 32 percent of total fuel use. At the same time, this industry contributes 14 percent to the economy (GDP).
The total share of biomass used as fuel has increased in Sweden from 37 percent in 2008 to 47 percent in 2017. Total fuel use increased between 2016 and 2017 due to an increased amount of biofuels. This increased use of biofuels is visible in all industries.
The share of biofuel, that is, biofuel use in relation to total fuel use (fossil + biogenic) in each industry, is largest among electricity, gas and the district heating plants and manufacturing industries. These industries also account for the highest level of total biofuel use.

Source: Statistics Sweden, Environmental accounts
Greenhouse gas emissions increased in 2017
In 2017, emissions by the Swedish economy and households amounted to 63 million tonnes of carbon dioxide equivalents. This is an increase of 2 percent compared with the previous year.
Emissions decreased by roughly 12 percent in the period 2008–2017. In the same period, the GDP, which describes the size of the economy, grew by 17 percent. Greenhouse gas emissions followed the economic trend in the period 2008–2010, but in the following years, the emissions level decreased while the economy grew. In the later years, 2014–2017, the economy continued to grow while emissions have slowed to a relatively constant level.

*2017 GDP is preliminary statistics Source: Statistics Sweden, Environmental Accounts, National Accounts
Emissions by the energy industry and households decreased
How emission levels develop varies between different industries. Greenhouse gas emissions by the electricity, gas and heating industry had a downward trend in 2010–2015. Emissions increased in 2016, but decreased again in 2017. At the same time, fossil fuel use in the industry decreased. This may be due to a warm winter in 2017 compared with previous years.
Greenhouse gas emissions by households also decreased in 2017. Emissions mainly originates from fuels for transport. Emissions decreased by 2 percent in 2017 compared with 2016. Greenhouse gas emissions by households have decreased by 17 percent compared with 2008, when the time series began. This decline in emissions is partly explained by reduced use of fossil fuels in vehicles. The use of biofuels for household transport is increasing instead.
Greenhouse gas emissions also increased in some industries in 2017 compared with 2016. Greenhouse gas emissions by the transport industry increased by roughly 8 percent. The sea transport industry is the largest contributor to emissions in the transport industry and accounts for 57 percent. Emissions in this industry increased by 14 percent between 2016 and 2017, mainly due to international transport. Emissions by the aviation industry also increased, by 7 percent, in the same time period. However, the land transport industry decreased its emissions of greenhouse gases by 6 percent.
Greenhouse gas emissions by the agriculture industry increased by 4 percent between 2016 and 2017. This increase is mainly explained by increased use of inorganic fertiliser and increased number of meat cattle. Emissions in this industry have been relatively stable since the time series started in 2008.

Source: Statistics Sweden, Environmental Accounts
Environmental-economic profile updated in autumn 2018
Statistic Sweden’s Environmental Accounts also reports various industries’ emissions in relation to the employment rate and value added (industries’ contribution to GDP). However, the statistics concerning annual air emissions are prepared earlier than the annual statistics on the employment rate and value added. Therefore, emission intensities and environmental-economic profiles will be updated in the autumn, when the 2017 data becomes available.
Use the analytical tool for environmental economic data
The Environmental Accounts data is available via an analytical tool online that combines data from the Environmental Accounts and economic data, where emissions statistics from both a production and a consumption perspective can be analysed further together with environmental-economic instruments. This analytical tool is available on the Environmental Accounts’ webpage:
System of Environmental and Economic Accounts
It can be used to compare industries and study the relationship between demand in the economy, energy use and emissions of various substances.
Definitions and explanations
The Environmental Accounts present national environmental statistics and economic statistics in the same framework using NACE industry classification. Environmentally-related statistics connected to the system of national accounts enable an analysis between the economy and the environment. The starting point is Swedish economic actors’ environmental impact, regardless of where in the world the emissions occur. Emissions from international bunkers, that is, international aviation and navigation arriving and refuelling at Swedish airports and harbours are included as an approximation of Swedish companies’ emissions from international aviation and shipping. Emissions and removals from land use and land use change (LULUCF) and carbon capture and storage (CCS) are not included.
These statistics on air emissions are based on a production perspective. Emissions are reported for the industry where emissions occur. Indirect emissions from imports and other consumption of goods and services are not included.
Statistics on emissions to air provided by the Swedish Environmental Protection Agency (EPA) follow the UNFCCC framework, covering emissions within Sweden’s territory. Sectors are listed by emissions category, not by industry. Emissions and removals from land use and land use change are included, while emissions from international aviation and navigation are reported separately. See:
http://www.naturvardsverket.se/klimatutslapp (in Swedish).
Comparison of the Environmental Accounts’s data on total production-based emissions and the Swedish EPA’s data on total territory-based emissions
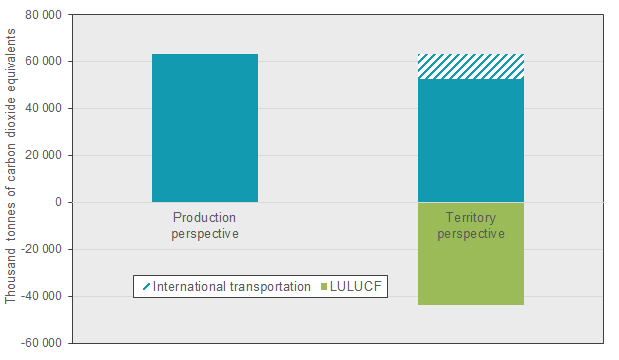
Source: Statistics Sweden, Environmental Accounts and the Swedish Environmental Protection Agency
Since the last publication, a number of revisions have been made for 2008–2016 due to updated statistics and some minor changes in methodology. More information (in Swedish) is available at: www.scb.se/mi1301 under Documentation.
Next publishing will be
The next statistical news on quarterly emissions to air up to the fourth quarter of 2018 is scheduled for publication on 2019-05-09 at 09:30. Preliminary annual statistics for 2018 will be published at the same time.
The next statistical news on annual emissions to air, 2008–2018 (final statistics) is scheduled for publication in spring 2020.
Statistical Database
More information is available in the Statistical Database
Feel free to use the facts from this statistical news but remember to state Source: Statistics Sweden.