Environmental Accounts – Emissions to air third quarter 2022
Greenhouse gas emissions from households decrease in the third quarter of 2022
Statistical news from Statistics Sweden 2023-02-02 8.00
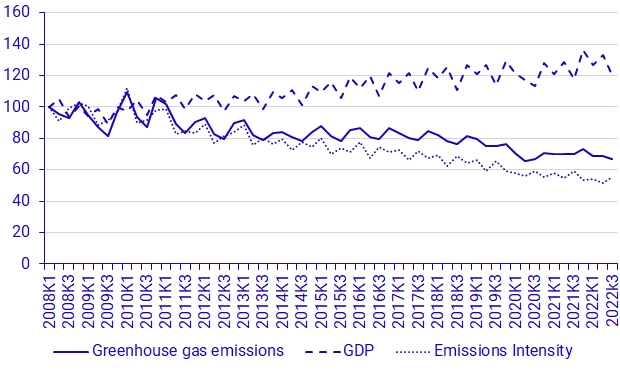
Greenhouse gas emissions from Swedish households decrease by 11 percent in the third quarter of 2022 compared with the same quarter in 2021. This decrease is due to reduced emissions from passenger cars which is an effect of increasing shares of biofuels in diesel and other factors. Compared to pre-pandemic levels Swedish households have reduced their emissions by 16 percent.
– Swedish households reduced their emission by 250 kilo tons in the third quarter. This decrease is of the same magnitude as for the second quarter of 2020 at the beginning of the pandemic, explains Annika Damm, analyst at Statistics Sweden environmental accounts.
Emissions from the Swedish economy overall decrease by 4 percent in the third quarter of 2022 to 11.7 million tons of carbon dioxide equivalent, while GDP increases by 2.5 percent. Reduced emissions from households’ passenger cars made up 50 percent of the total decrease of emissions from Sweden’s economy.
Source: Statistics Sweden.
Changes in the third quarter 2022 in brief
The percentage changes below are based on a comparison with the third quarter of 2021, unless otherwise stated. Greenhouse gas emissions are measured in carbon dioxide equivalents.
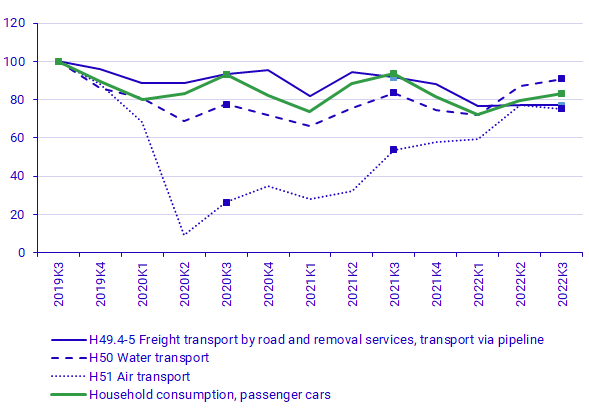
- Emissions from the air transport industry increased by 143 kt Emissions from the transport industry overall increase by only 100 kt due to decreased emissions from road transport and
- Emissions from private consumption decrease by 11 percent, which is a decrease of 250 kt as a result of reduced use of fossil diesel and petrol in private transport.
- The agriculture, forestry and fishing industry, the construction industry as well as other services reduce emissions by 64 ,66 and 92 kt, respectively, which corresponds to a reduction of 3, 15 and 11 percent, respectively.
Source: Statistics Sweden.
| NACE 2007 industry | Greenhouse gas emissions | Value added | ||||
|---|---|---|---|---|---|---|
| 2022Q3 | Change compared to 2021Q3 | 2022Q3 | Change compared to 2021Q3 | |||
| Agriculture, forestry and fishery | 2 133 | ‑64 | ‑2.9% | 17 146 | ‑1 197 | ‑6.5% |
| Mining | 212 | ‑5 | ‑2.5% | 10 049 | ‑233 | ‑2.3% |
| Manufacturing | 3 388 | ‑34 | ‑1.0% | 165 622 | 9 363 | 6.0% |
| Electricity, gas, heat, water, waste | 1 194 | ‑58 | ‑4.6% | 40 822 | 2 326 | 6.0% |
| Construction | 379 | ‑66 | ‑14.8% | 72 537 | 3 505 | 5.1% |
| Transport | 1 518 | 100 | 7.1% | 48 094 | 2 087 | 4.5% |
| Other services | 713 | ‑92 | ‑11.4% | 590 032 | 19 263 | 3.4% |
| Public sector | 87 | ‑9 | ‑9.7% | 207 543 | 2 604 | 1.3% |
| Households and non-profit institutions [1] | 2 057 | ‑250 | ‑10.8% | 15 204 | 618 | 4.2% |
| Total economy [2] | 11 681 | ‑478 | ‑3.9% | 1 304 102 | 31 910 | 2.5% |
[1] Only non-profit institutions provide value added. [2] GDP with a production approach.
Source: Statistics Sweden
Definitions and explanations
What do the quarterly statistics show?
The quarterly statistics from Statistics Sweden's environmental accounts report production-based emissions to air per industry from the Swedish economy, which also includes households. Production-based emissions are emissions of greenhouse gases by Swedish economic actors. The statistics include the emissions from Swedish companies and individuals that occur both outside and inside Sweden's borders. Production-based emissions use the same system boundary as the national economic statistics, i.e. the national accounts.
For the transport industry, emissions arising from transports with economic residence in Sweden are included, regardless of where in the world these emissions occur. Emissions from e.g., foreign airlines flying to, from or within Sweden are not included.
When comparing quarters, the reader should be attentive to seasonal variation. E.g. Emissions from electricity, gas, heat, water, waste are higher during the winter whereas private consumption of diesel and petrol are higher during the summer.
Revisions
For the third quarter of 2022, a new division of the transportation sector is presented in tables and figures related to this statistical news. The transport sector is broken down into three separate sectors –
- Freight transport by road and removal services, and transport via pipeline
- Water transport
- Air transport
The statistics also show the emissions arising from private consumption of transportation fuels.
For this publication, new data on stationary combustion are incorporated. This has led to changes of 10-30 kilo ton in the time series between 2015-2022 for C24-C25 basic metals and fabricated metal products, except machinery and equipment, G45-G47 wholesale and retail trade, H49-H53 transport and storage.
More information about emissions accounting is available on the Statistics Sweden’s website (in Swedish): Dokumentation.
Next publishing will be
The next statistical news on quarterly emissions to air for the fourth quarter of 2022, is scheduled for 11th May 2023.
Statistical Database
More information is available in the Statistical Database
Feel free to use the facts from this statistical news but remember to state Source: Statistics Sweden.